
Query your data
Managed Postgres, three ways to ask it a question — the CLI, the console's browser, and a client on your laptop through the proxy.
Most internal tools are a thin layer over data. Dibbla gives you managed Postgres and three honest ways to look at what is in it.
Create one
$dibbla db create lumen_incidents
Secret: DATABASE_URL_LUMEN_INCIDENTS (auto-created)
Databases are org-scoped, not app-scoped: one list for the organisation, and apps reach a database through an injected connection-string secret rather than by owning it. That indirection is deliberate — two apps can share a database without either being its parent.
Every managed database gets a secret named DATABASE_URL_<NAME> — never a
plain DATABASE_URL, whatever its scope. Application code has to read the
suffixed variable; this catches people once. Scope is a separate axis:
global to the org by default, or tied to one deployment with
--deployment.
Browse it in the console
Databases → Browse opens the data browser: tables down the side, rows in a paginated grid.
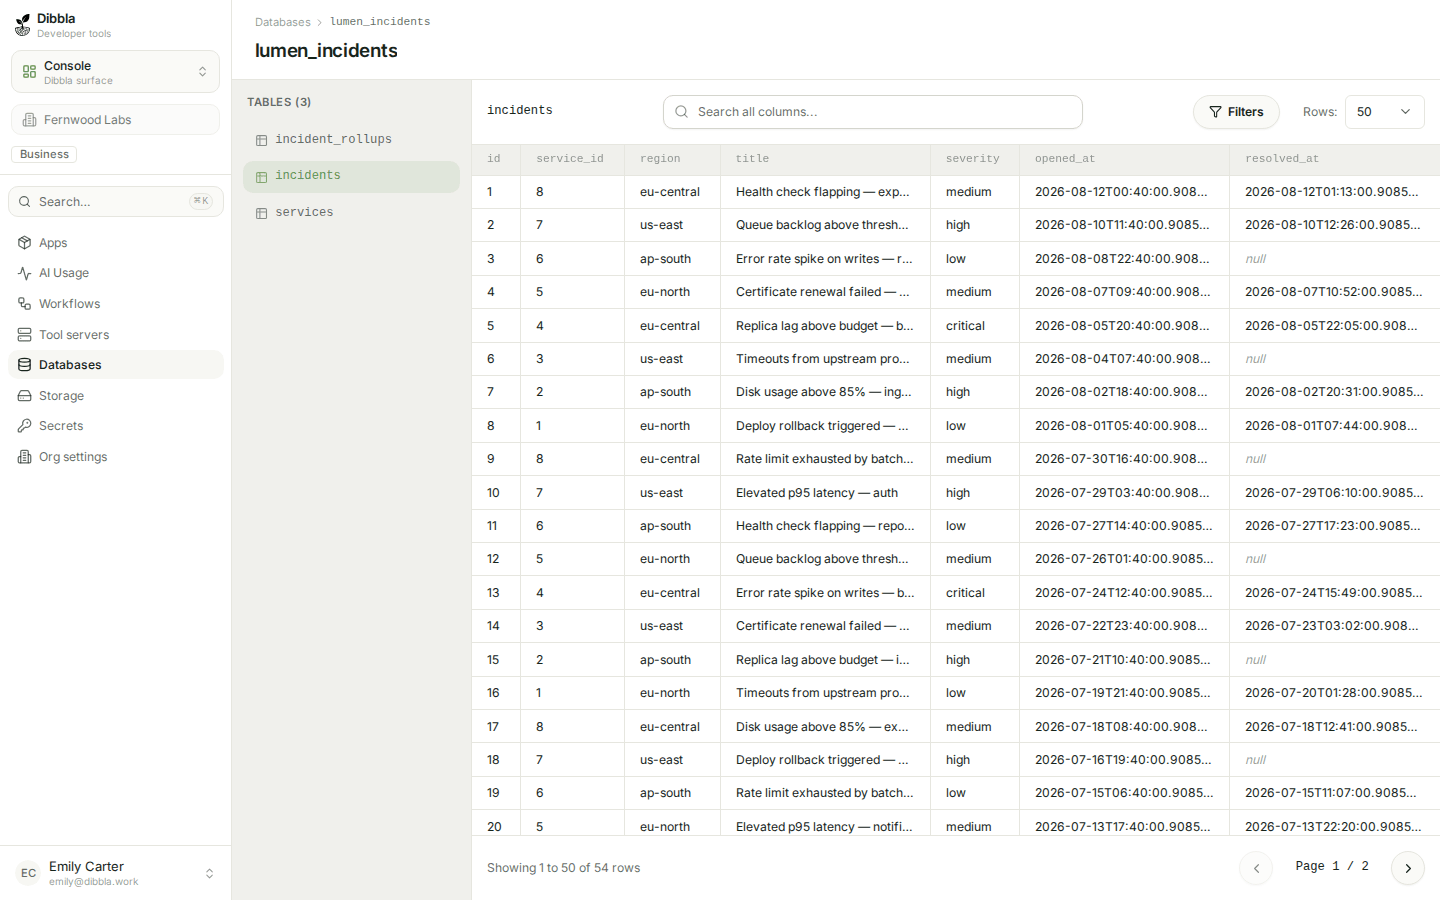
The search box above the grid filters across all columns, server-side — so it works on a table far larger than one page, and narrows the result rather than the current page:
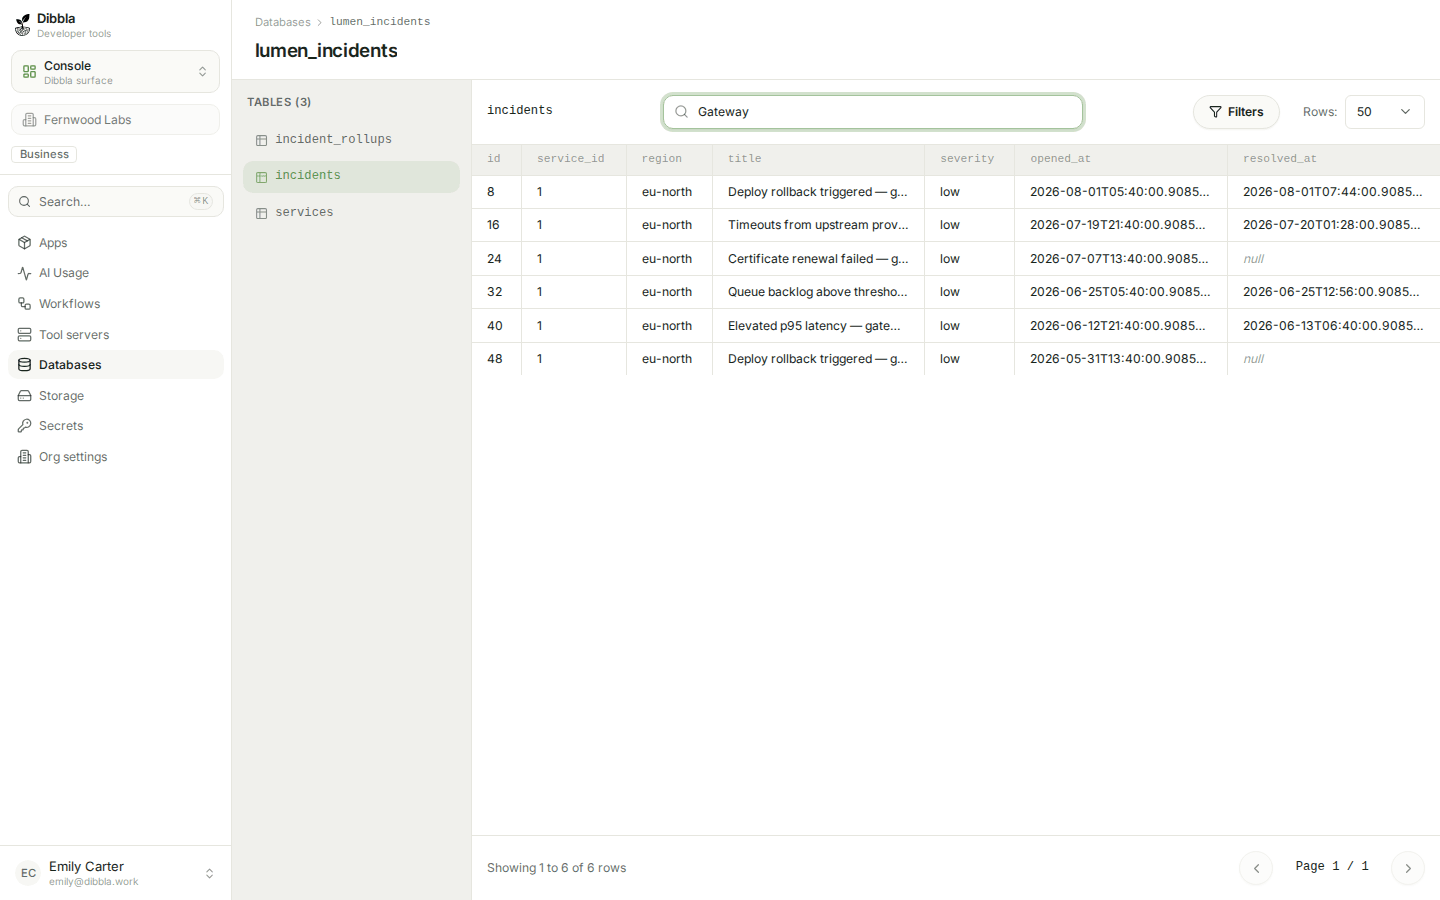
Per-column filters sit beside each header for when you know which column you care about. The browser is read-only: it is for answering questions, not for editing production rows by hand.
Query it from the CLI
dibbla db connect prints a connection string. Pass it straight to a client
as an argument — never display it, because the password slot holds your API
token:
$psql $(dibbla db connect lumen_incidents -q)

# one query, non-interactive
$psql "$(dibbla db connect lumen_incidents -q)" -c "SELECT region, count(*) FROM incidents WHERE resolved_at IS NULL GROUP BY region"
# the same command works off-cluster: the CLI asks the
# platform where the database proxy is and builds the DSN
# for you, with your API token as the password
$psql $(dibbla db connect lumen_incidents -q)
It embeds your API token, so keep it inside a $( … ) and out of
screenshots, tickets and chat messages.
Specifically do not pipe it: dibbla db connect … -q | psql looks
plausible and is wrong, because psql reads standard input as SQL. It
would try to execute your connection string as a statement and echo it —
token included — back into the terminal inside the syntax error. Command
substitution passes it as an argument instead, which is what
dibbla db connect --help shows.
Have a code agent answer a question from the data without ever showing you the connection string.
Using the dibbla CLI, query my Dibbla database "lumen_incidents" and tell me
how many incidents are still unresolved, broken down by region. Pass the
connection string to psql with command substitution — psql $(dibbla db connect
... -q) — rather than printing it, and show me the SQL you ran alongside the
result.
Backups and moving data
dibbla db dump and dibbla db restore move a database in and out as a file —
the same pair covers “take a backup before I try something” and “seed the new
environment from the old one”.
Plan limits
On plan-billed organizations, dibbla db create counts toward the plan’s
database limit (see Plans & limits). At the limit the
create is refused with PLAN_LIMIT_EXCEEDED and a docs link — existing
databases keep running and stay fully usable; only creating more is gated.
Self-hosted installations have no plan concept and no limits.