
Stage 4 — Give it a workflow
Create the incident_triage workflow, back one of its nodes with a function of your own running on a tool server you start, and call the whole graph from Lumen over HTTP.
This is the first stage where you run something of your own outside the app. Lumen has summarised a single incident on demand; now you give it a workflow — a small graph of steps — and back one of those steps with a function you write and run on your own machine. Then you call the whole graph from Lumen over HTTP.
Create the incident_triage workflow and call it from Lumen.
Create a Dibbla workflow named "incident_triage" from a slim YAML file with three
nodes: an api node taking a "question", a function node that answers it, and an
api_response node linked back to the api node. Then write a small Go tool server
with the Dibbla SDK using sdk.NewSimpleFunction (not NewFunction) for a custom
function, and run it under SERVER_NAME=lumen-worker so the workflow's server:
field can point at it. Create the workflow with `dibbla wf create -f`. Finally,
have Lumen call the workflow over POST
https://api.dibbla.com/api/wf/execute/<name>/<nodeIdWithoutDash> with a Bearer
ak_ token and ?async=true, then poll with `dibbla wf runs list -w
incident_triage` and `dibbla wf runs output <runId>`. Confirm the newest run's
ORIGIN is app:lumen and show me the verdict.
What happens next
Hand your assistant the prompt above and let it work. You do not have to know Go, or gRPC, or what a “node” is to follow along — a workflow is just a visual graph of steps, boxes joined by arrows that carry data. Your assistant builds one and wires it up; your job is to watch it come together and check the result.
Expect three moves. First, it authors a small three-node graph called
incident_triage: a step that takes a question in, a step that thinks about the
answer, and a step that hands the answer back. Second, it backs the middle step
with a tiny function running on your own machine — nothing to deploy, nothing to
expose. Third, it makes Lumen call the whole graph so the app itself, not you at
a terminal, is what kicks off a run.
Two things become visible while it does this. Open the workflow in the visual
editor and you will see the graph — three nodes joined by two edges. Each time
the workflow runs, a new entry appears in the runs list with its result,
latency and actor. The table does not show the request’s origin header; the CLI
check below is what confirms that Lumen stamped the newest run as app:lumen.
One honest caveat: the thinking step is an AI agent, so the exact wording of a verdict varies from run to run. The shape — a priority, a severity, an escalation order — is what stays put.
Here is the graph your assistant produces, open in the visual editor — three nodes joined by two edges:
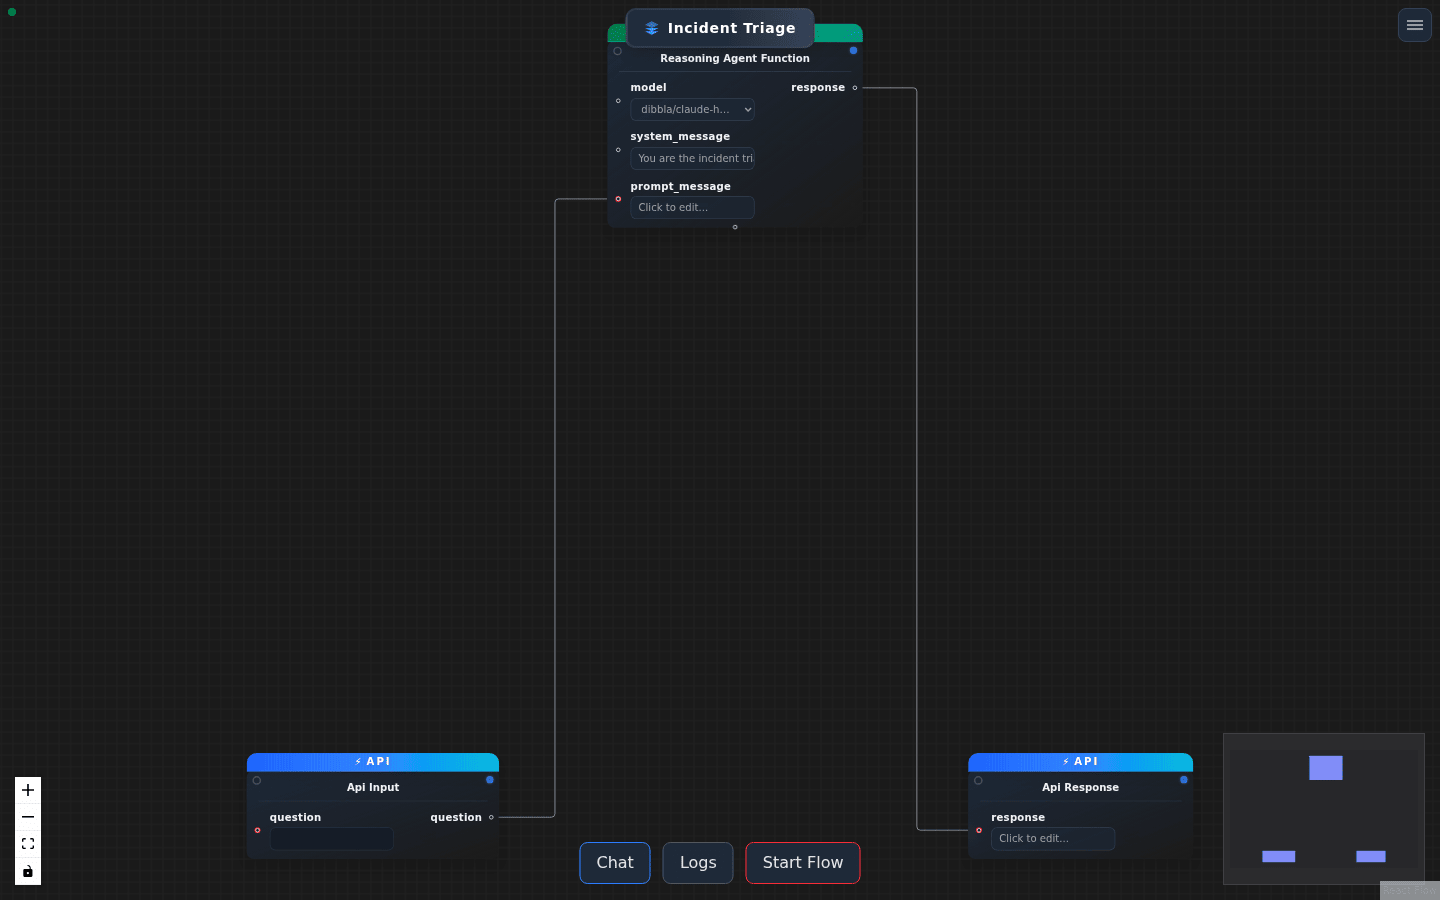
The three steps of incident_triage, laid out as a graph you can inspect and rewire.
Each execution appears in the runs list, where you can filter to the incident fixture and compare its result, latency and actor without opening it:
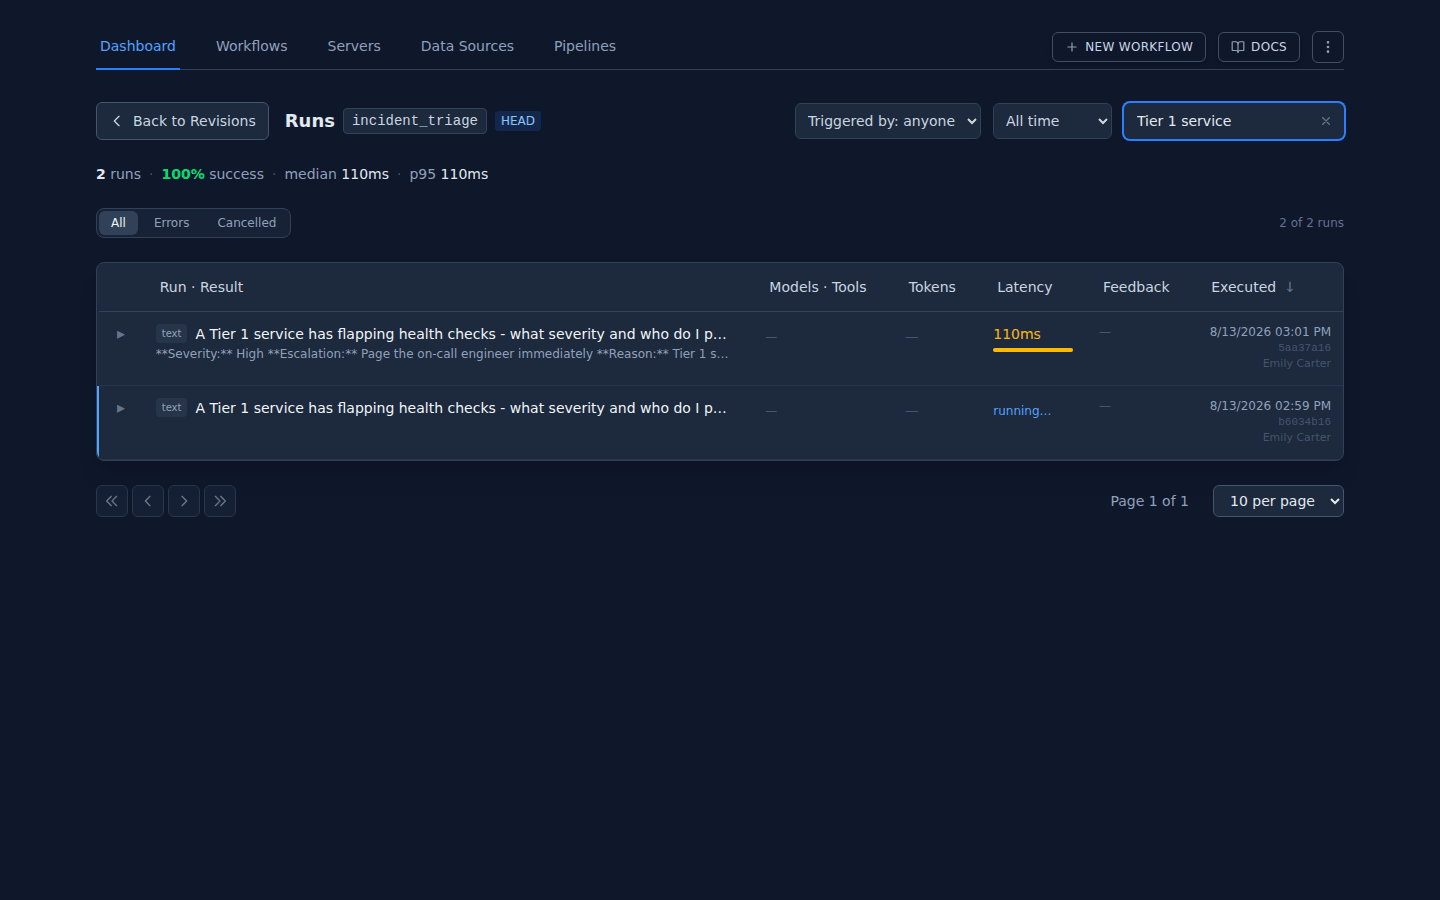
The runs view filtered to the incident fixture, with each execution’s result and operational context.
Open a completed incident run to read the received question, returned verdict and the steps that produced it:
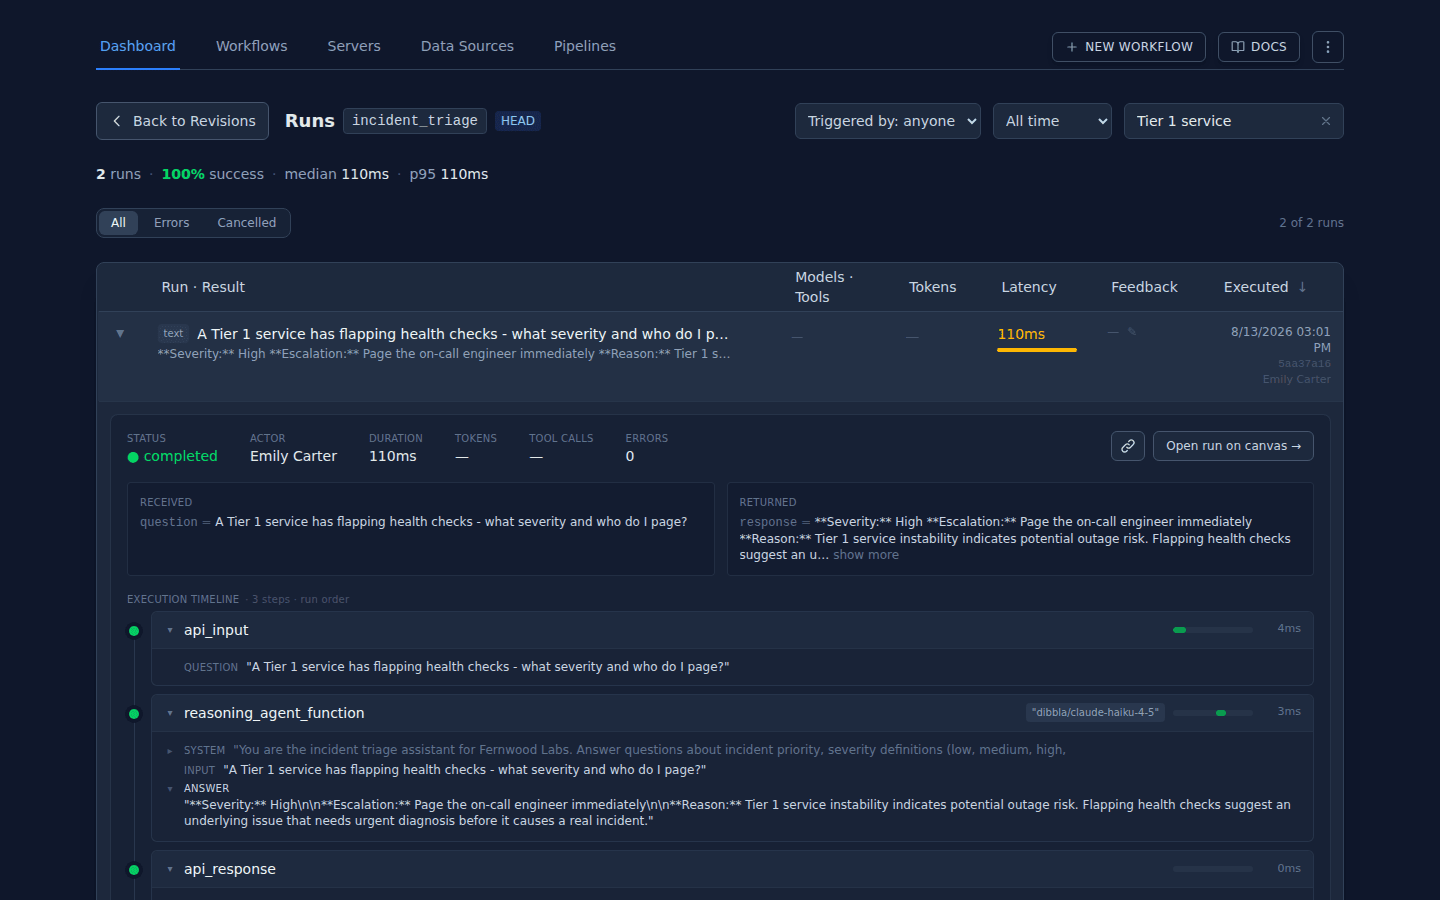
An expanded incident run: the full exchange and its step-by-step timeline. Exact AI wording varies between executions.
Under the hood the CLI & code behind this step — optional
1. Create the workflow
A workflow is authored as slim YAML and created with dibbla wf create -f. The
one you build here, incident_triage, is a three-node graph: an API node
that takes a question, a function node that answers it, and an
api_response node that hands the answer back to whoever called the API node.
name: incident_triage
nodes:
  - { id: api_input, type: api, inputs: [question], outputs: [question] }
  - id: reasoning_agent_function
    type: function
    function: reasoning_agent_function
    server: function-server
    inputs:
      system_message: "You are the incident triage assistant. Answer questions about priority, severity (low, medium, high, critical) and escalation order. Be brief."
      model: dibbla/claude-haiku-4-5
    outputs: [response]
  - {
      id: api_response,
      type: api_response,
      linked_to: api_input,
      inputs: [response],
    }
edges:
  - api_input.question -> reasoning_agent_function.prompt_message
- reasoning_agent_function.response -> api_response.response$dibbla wf create -f incident_triage.yaml # prints the workflow name and a revision id once the graph validates
If you open the graph editor to inspect it, an empty canvas shows no
affordance for adding the first node. Right-click the canvas to get the
node menu. This is a known gap in the editor, not a broken page — authoring
from YAML with dibbla wf create sidesteps it entirely.
The agent function above declares a single output, response — it has no
error output. Wiring anything from a non-existent error port fails
validation with UNSATISFIED_INPUT. Wire response, and nothing else, out of
that node.
2. A tool server is a client, not a server
Here is the single fact that makes workflows click. A tool server — the name
for an execution server, the process that hosts your workflow-node functions —
is a gRPC client, not a server you expose. It dials out to
grpc.dibbla.com:443 and holds one long-lived bidirectional stream. There is
no open port, no public URL, and no deploy. That is precisely why you can
run one on your own laptop and have a production workflow call into it: the
platform never connects to you; your process connects to the platform and stays
connected, serving dispatches over that one stream.
So the function node in the graph is answered by code you write with the Go SDK
and run yourself. Use sdk.NewSimpleFunction — off-repo code must — pick a name
for your server (say lumen-worker), and that name is exactly what goes in the
node’s server: field.
package main

import (
    "log"
    "os"

    sdk "github.com/dibbla-agents/sdk-go"
)

type In struct {
    Question string `json:"question"`
}
type Out struct {
    Response string `json:"response"`
}

func main() {
    // NewSimpleFunction is the only builder off-repo code can use (see below).
    triage := sdk.NewSimpleFunction[In, Out](
        "triage_lookup", "1.0.0", "Answer an incident-triage question.",
    ).WithHandler(func(in In) (Out, error) {
        // your logic — a lookup table, a policy check, whatever you like
        return Out{Response: "…"}, nil
    })

    server, err := sdk.New(
        sdk.WithServerName(os.Getenv("SERVER_NAME")),
        sdk.WithServerApiToken(os.Getenv("SERVER_API_TOKEN")),
    )
    if err != nil {
        log.Fatal(err)
    }

    // Register before Start(); Start() advertises it, then blocks serving.
    server.RegisterFunction(triage)
    if err := server.Start(); err != nil {
        log.Fatal(err)
    }
}# the name you pick here is what the workflow's server: field must match $SERVER_NAME=lumen-worker \ $SERVER_API_TOKEN="$TOKEN" go run . # it dials OUT to grpc.dibbla.com:443 and stays connected — no port is opened on your side
With it running, dibbla functions lists the functions the platform can see —
your triage_lookup under lumen-worker, alongside the platform’s built-ins
under function-server. That contrast is the whole point of the next callout.
Five things trip up a first tool server, each documented somewhere and none of them together:
NewSimpleFunctiononly. The advancedsdk.NewFunctionbuilder takes a handler whose signature needs types from the SDK’sinternal/packages, which Go forbids any other module from importing. Off-repo code cannot use it, whatever a README shows.- The registry is in-memory, with no registration API. A function exists only while its worker is connected. Stop the process and the function leaves the registry; it comes back when the worker reconnects, not before.
server:names your server, not the platform’s.function-serveris where the platform’s built-in functions live. Your function lives under the name you chose (lumen-worker) — setSERVER_NAMEto it and write the same string inserver:.- Wire only declared outputs. As in step 1: the agent node has no
erroroutput, so onlyresponsemay be wired out of it. - The editor has no empty state. If you author in the canvas rather than YAML, right-click to place the first node.
3. Call it from Lumen
The app calls the workflow over an endpoint that accepts a token:
POST https://api.dibbla.com/api/wf/execute/<name>/<nodeIdWithoutDash>
Authorization: Bearer ak_…
Two details bite if you miss them. The host is api.dibbla.com — the token
endpoint lives there, not on the portal host. And the last path segment is the
API node’s id with its hyphen stripped: an id like biih-d39h becomes
biihd39h. (Confirm the id and build the exact URL for your environment with
dibbla wf api-docs, which prints it — the host it emits is
environment-dependent, so read it rather than assuming.)
Execution is synchronous by default, with a 30-minute server ceiling. The
Cloudflare edge in front of it, though, cuts the connection at about 120
seconds — so a slow agent run returns an edge timeout even though the run is
still going. Add ?async=true, which returns a run id immediately, and
poll for the result.
# Lumen POSTs to the endpoint with ?async=true and gets a runId back
$dibbla wf runs list -w incident_triage
# shows recent runs, newest first, each with a runId and status
$dibbla wf runs output <runId>
# prints the triage verdict once the run is COMPLETED
4. Check it
A run happening is not the same as your app causing it. Lumen stamps every
call it makes with the header X-Dibbla-Origin-Kind: app, so the run records
Lumen as its origin. List the runs and the newest one shows an ORIGIN of
app:lumen — that column is the difference between “a workflow ran” and “Lumen
ran it”:
$dibbla wf runs list -w incident_triage
# the newest run's ORIGIN column reads app:lumen — stamped by the X-Dibbla-Origin-Kind: app header
$dibbla wf runs output <runId>
# returns the triage verdict for the question Lumen asked
Next: run it on a schedule
Lumen now triggers a workflow on demand. The last stage turns a one-off into standing behaviour: a nightly pipeline that rolls incidents up by region and writes the result back where the app can display it — closing the loop on the app you started with.