
Read production logs
Live logs in the console and the same stream from the CLI — merged across services by default, filterable, and available without kubectl.
When something misbehaves you need the logs, and you need them without asking anyone for cluster access. Both surfaces read the same stream.
Read your app's production logs.
Show me the most recent errors from the production logs for my Dibbla app
"my-first-app". Then follow the logs live while I reproduce the problem in the
browser, and when the error appears tell me which line it came from. If the app
has more than one service, once we know where it's happening, filter the stream
down to just that one service.
What happens next
Ask your code assistant to read the logs and it pulls the recent window for the app, scans it for errors, and hands you the ones that matter rather than the whole scroll. Ask it to follow along and it keeps the stream open, watching new lines arrive as you click through the app — so the failing request shows up in front of you, in time order, the moment it happens.
Because Dibbla merges every service’s output by default, the assistant sees the whole path a request takes — from your web service into your worker — and can point at the exact line where it broke. Ask it to narrow to one service and the noise from the others drops away.
It decides on its own which window to read and how to filter, so two runs may summarise things differently. The underlying stream is the same one the console shows you below.
In the console
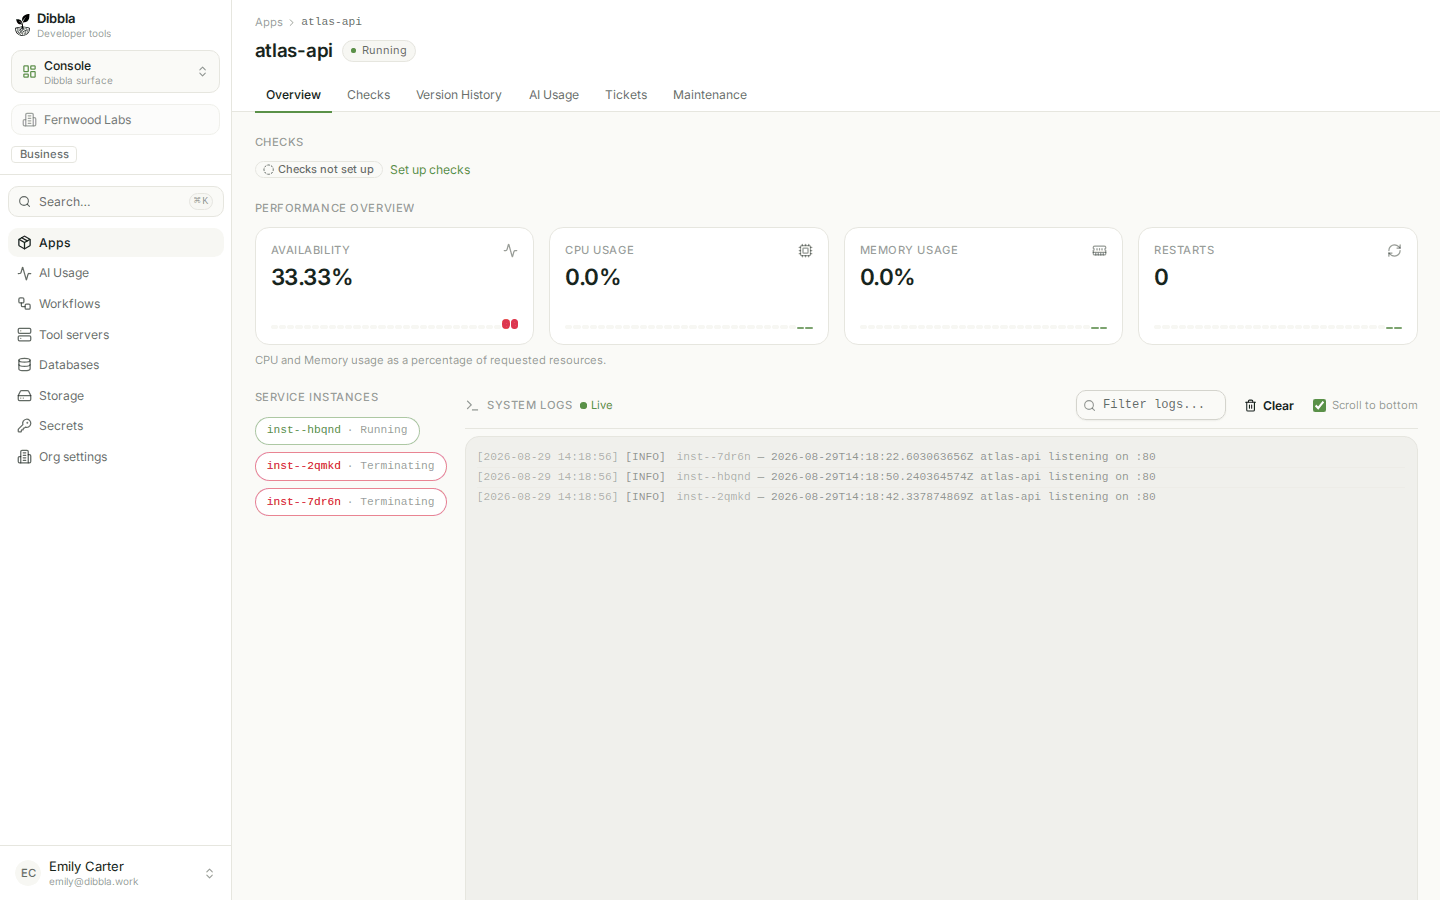
The app’s overview page carries its state — replicas, resources, the URL — and the log pane underneath it.
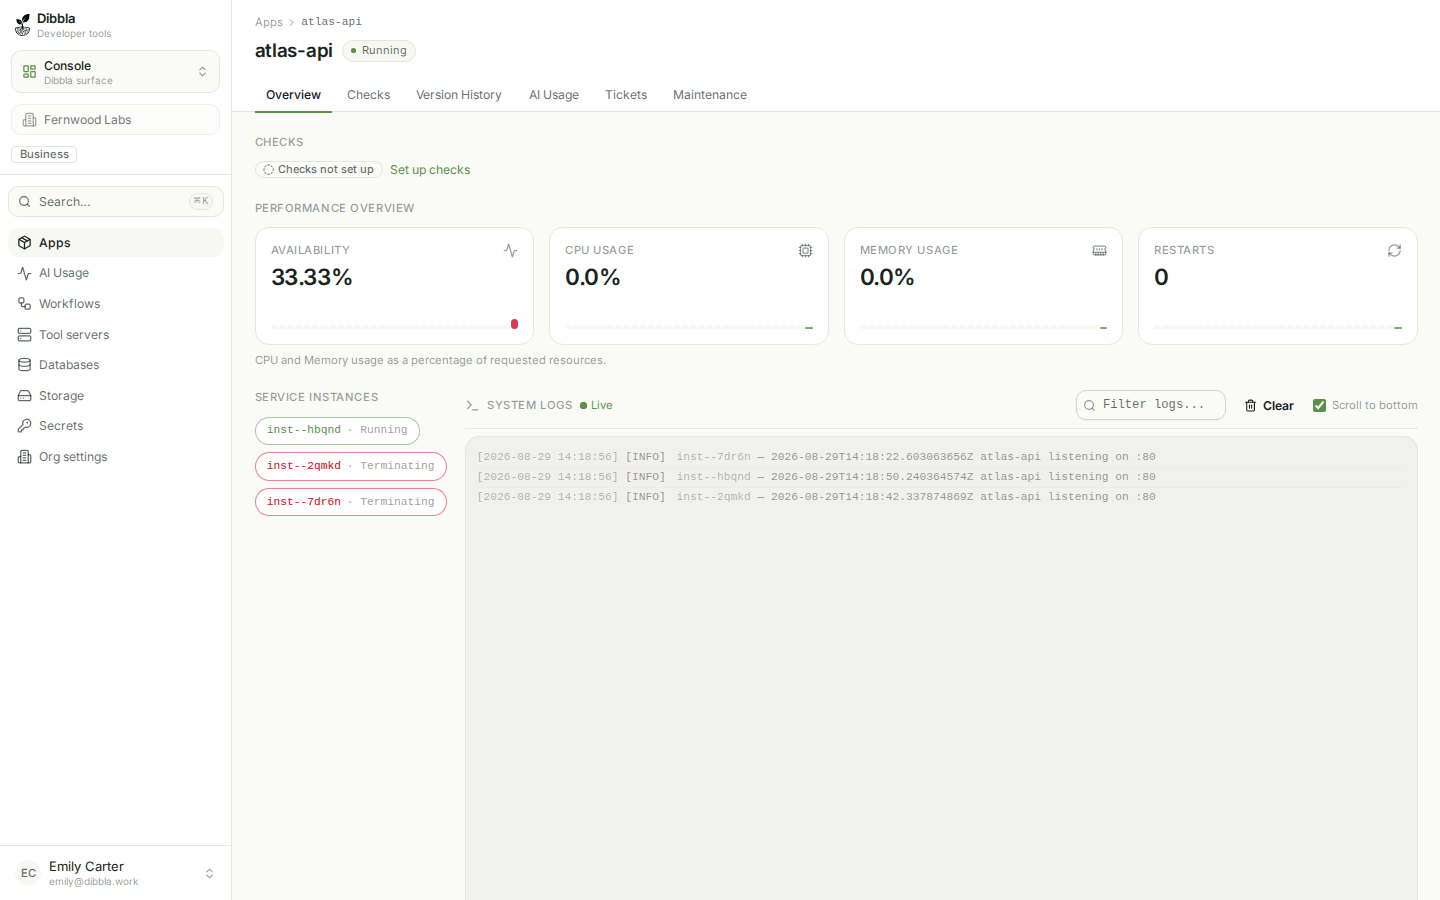
The pane streams. Lines appear as your app writes them, which is what you want while reproducing something.
Under the hood the CLI & code behind this step — optional
From the CLI
The same output, in the terminal you are already in:
# last 15 minutes, all services
$dibbla logs my-first-app

# follow, like tail -f
$dibbla logs my-first-app -f

# widen the window, or narrow the noise
$dibbla logs my-first-app --since 24h
$dibbla logs my-first-app --grep "level=error"
# by default: every service, merged
$dibbla logs beacon

# one service only
$dibbla logs beacon --service api
$dibbla logs my-first-app --json -n 200 On an app with several services, omitting --service gives you every
service’s output interleaved in time order. When a request crosses from your
web service into your worker, that merged view is the only one that shows
the whole story.
What to log
Two habits pay for themselves here. Write structured lines — a level and a
handful of key-value pairs beat a prose sentence when you are grepping at 2am.
And log the identity your app received in its X-User-* headers on anything
that mutates data, because “who did this?” is the question a shared internal
tool raises most often.