
Pipelines and schedules
Batch jobs served by a Go worker, bound to parameters, a cron expression and a concurrency policy — including the alerts that fire when a scheduled run fails or stops happening.
Pipelines are the scheduled-batch story. They share a navigation bar with workflows and almost nothing else, which is the single most useful thing to know before you start.
| Workflow | Pipeline | |
|---|---|---|
| Unit of work | a graph of function calls | one Go job |
| Authored in | slim YAML or the editor | Go, with the SDK |
| Triggered by | HTTP, CLI, schedule | manual trigger or cron |
| Progress | per-node | per-task, with a progress counter |
A job is Go code
A pipeline job is not a workflow node. It is a handler your worker registers:
type ReportJob struct{}

func (j *ReportJob) GetJobID() string { return "incident_report" }
func (j *ReportJob) GetJobName() string { return "Incident Report" }

func (j *ReportJob) GetParameters() []jobs.JobParameter {
return []jobs.JobParameter{
{Name: "region", Type: "string", Required: true},
{Name: "rows", Type: "integer", Required: false, Default: 25},
{Name: "dry_run", Type: "boolean", Required: false, Default: true},
}
}

func (j *ReportJob) Execute(ctx *jobs.JobContext) error {
region := ctx.GetStringArg("region", "unset")

  ctx.Logger.TaskStarted("collect")
  ctx.Logger.Info("collecting for " + region)
  ctx.Logger.TaskCompleted()

  ctx.Logger.TaskStarted("process")
  for i := 0; i < 25; i++ {
      ctx.Logger.Progress(i+1, 25, "processing rows")
  }
  ctx.Logger.CompleteProgress()
  ctx.Logger.TaskCompleted()

  return nil

}
Register it with server.RegisterJob(&ReportJob{}) before Start(), exactly
as with functions — and with the same
GRPC_SERVER_ADDRESS warning: the SDK defaults
to production.
TaskStarted / TaskCompleted / TaskSkipped draw the task list.
Progress(i, total, msg) drives the progress bar. Info / Warn / Error
become log lines. A job that logs nothing renders an empty run screen — the
single most useful thing to know when writing your first one.
Hosts, then pipelines
Your worker appears under Tool servers once it has connected, with the number of jobs it advertises:
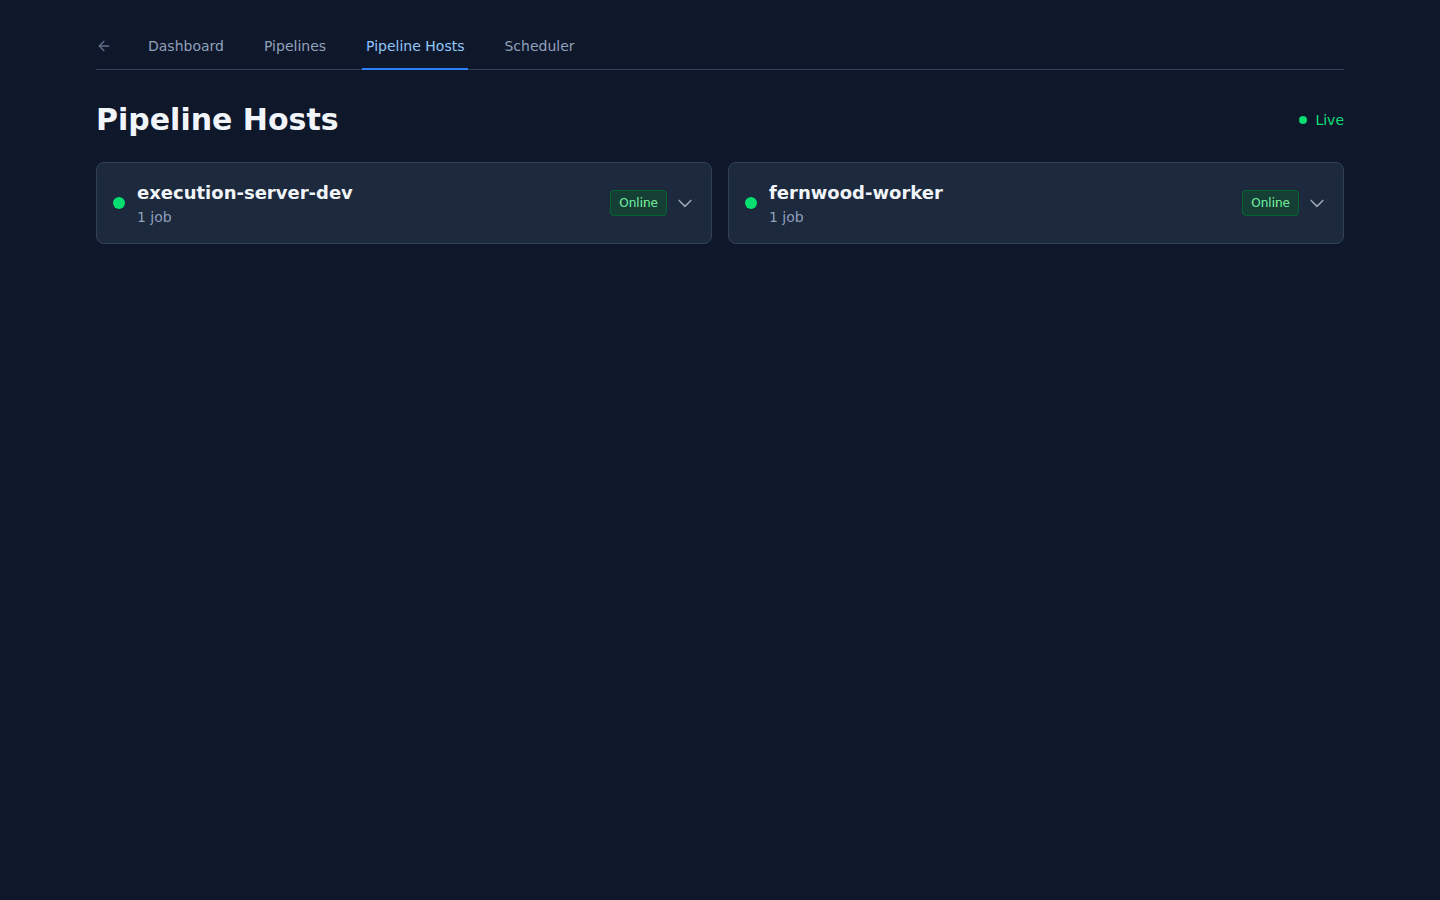
With no host online, every screen here is an empty state saying it is waiting for one. That is the normal first experience and not a misconfiguration.
A pipeline then binds one job to parameter values, an optional cron expression, and a concurrency policy — Skip, Queue, or Allow parallel runs. That last choice is a real operational decision: a nightly report probably wants Skip, a queue drainer probably wants Queue.
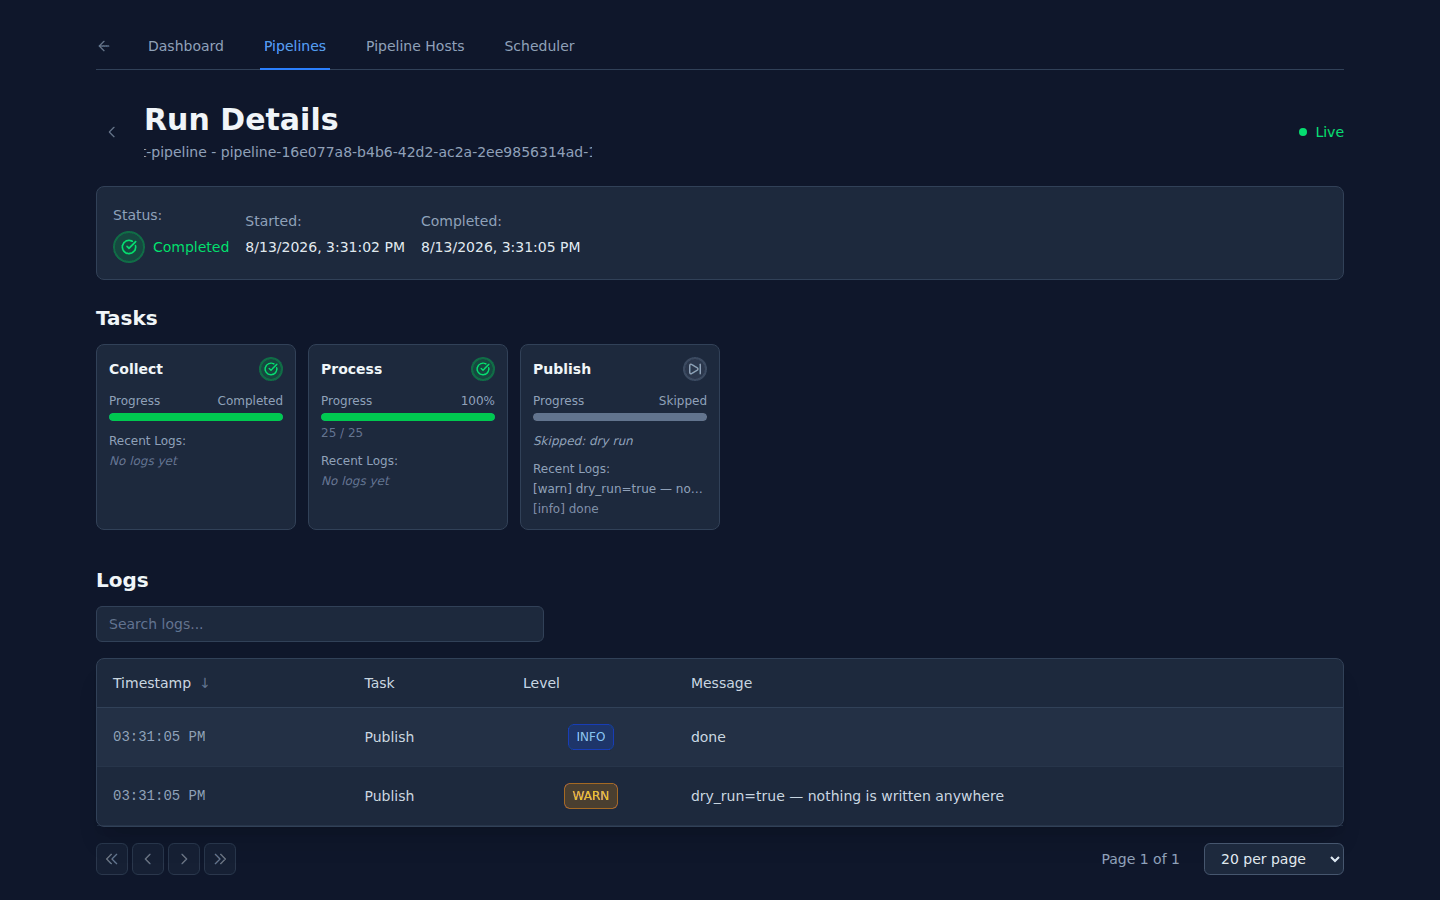
Runs show the tasks your handler declared, its progress and its logs:
Alerts: what tells you a run went wrong
A pipeline runs while nobody is watching, so the interesting question is not what the run screen shows — it is what reaches a person when the run goes red, or when it stops happening at all. Four events do that, and they are ordinary notification events: they route to the same email, Slack, webhook and Discourse channels as everything else on the platform.
| Event | When it fires |
|---|---|
pipeline.run.failed | The pipeline’s last run went from anything that was not failing into failed |
pipeline.run.recovered | A previously failing or silent pipeline completed a run |
pipeline.run.host_offline | No worker serving the pipeline’s job was connected at a scheduled time, so nothing ran |
pipeline.run.missed | A scheduled run did not happen for some other reason — stored parameters that no longer parse, or a trigger that could not be handed to the worker |
Alerts follow a transition, not a run. A pipeline that fails every night
wakes you once: the first failure alerts, the second and third are silent, and
the next successful run sends pipeline.run.recovered. A first-ever run that
fails does alert — a pipeline that has never once succeeded is not the case to
be quiet about. The rule applies to any terminal run, scheduled or triggered by
hand.
Silence alerts once, too. A worker that is down for a week against a
five-minute schedule is one pipeline.run.host_offline, not two thousand: the
event fires on entering the state, and only a terminal run clears it. That
clear also re-arms the alert, so a second outage after a recovery is news
again.
What does not alert
Three silences are deliberate, because alerting on them trains you to ignore the alert that matters:
- A run skipped by the concurrency policy.
Skipfiring is the policy you chose, working as asked. - A disabled pipeline. Paused on purpose is not an incident, and a pipeline disabled while it was alerting has its alert state cleared rather than left hanging.
- A pipeline with no cron expression. It was never promised a time, so there is no time it can miss.
What an alert contains
The pipeline’s name, a one-line cause, the run id, and a link straight to the run in the console. The cause is bounded and redacted at the source — a worker’s error string is the most likely place for a secret to appear in plain text, so assignments to sensitive names, tokens and URL credentials are replaced before the event leaves the platform, and multi-line text is cut to its first line. Run logs, stack traces and your trigger parameter values are never in the notification; the link is how you get to the detail.
For the silence events, the alert also states when the pipeline last completed a run successfully — or says outright that it never has. “Last successful run: Tuesday” is the difference between a blip and a week of lost batches.
Subscribing
There is a default you do not have to set up: the first pipeline.run.*
event in your organization creates a subscription to all four types on the
channel your organization has already connected, so a nightly batch alerts
even if nobody opened the notification settings. If no channel is connected
anywhere, nothing is seeded and the event simply has no subscribers yet — the
default is still waiting for you the day you connect one. If you disable or
delete that subscription, it stays gone; it is never re-created behind your
back.
To choose the routing yourself, add a subscription under Organization
settings → Integrations with the event type pipeline.run.* — that is all
four events, which is usually what you want, recovered included. See
Notifications for channels, digests and the exact
shape of a webhook delivery.
The link in an alert comes from the platform’s configured console URL, not from the API address. If your deployment has not set one, alerts are still delivered — they just carry no link, rather than one that answers JSON to a person at 03:00.
Scheduling a workflow instead
The Scheduler, in the same app, schedules workflows rather than jobs:
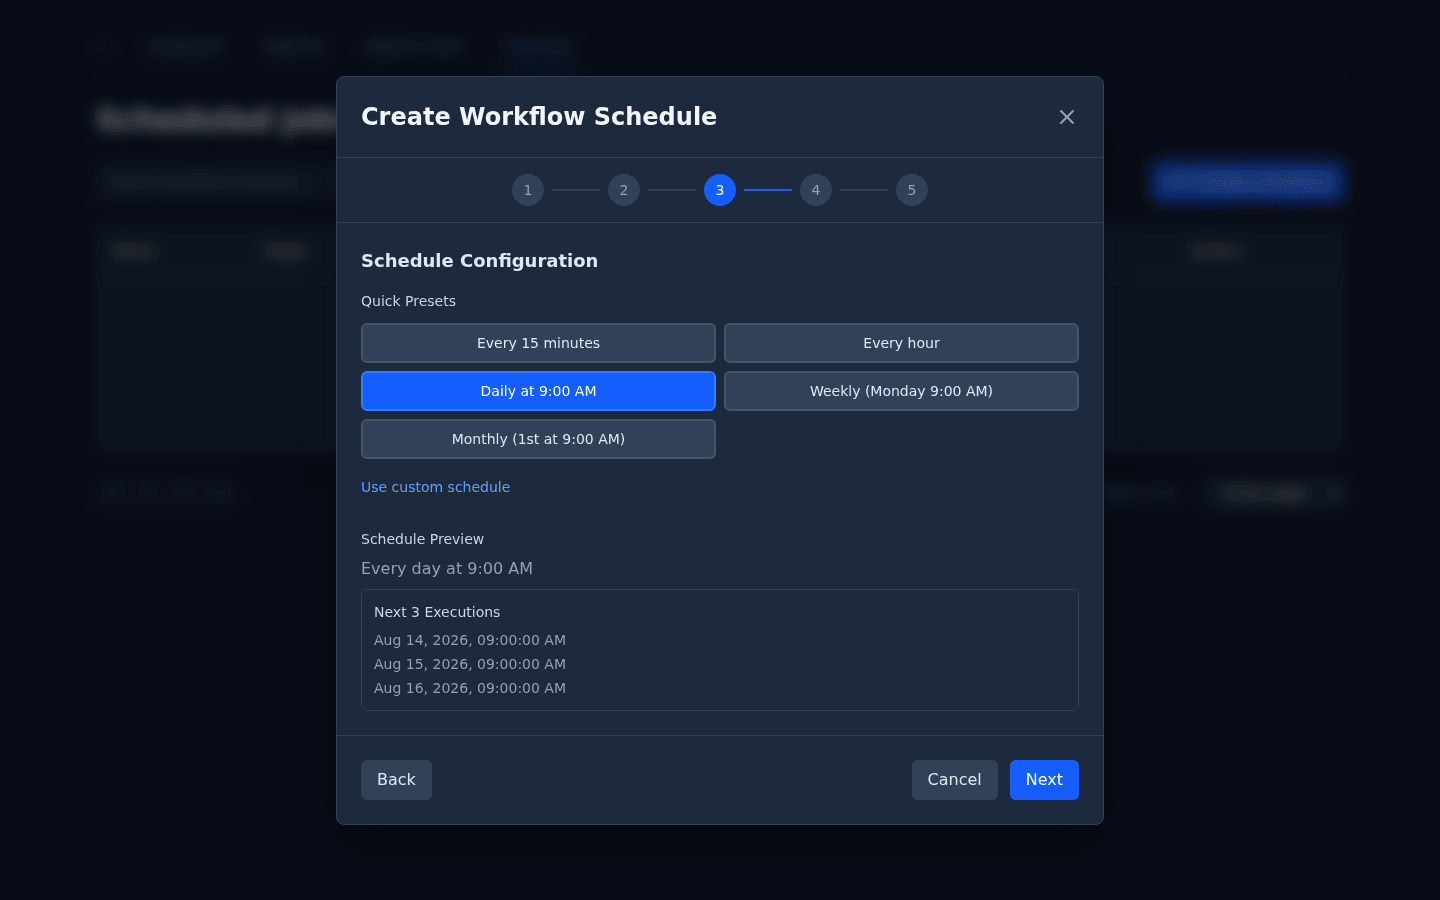
A workflow’s entry node has an id like biih-d39h; the scheduler wants
biihd39h. Nothing in the UI says so, and the editor never shows the id at
all — find it with dibbla wf api-docs <workflow>, whose execute URL ends
with it.