
Build a workflow in the editor
From an empty canvas to an agent that uses a tool and answers over HTTP — every click, with a screenshot for each step.
This is the graphical way to build a workflow, and for a first workflow it is the right one — you can see the shape of what you are making. Twenty minutes, no YAML, no CLI.
By the end you will have an agent that decides when to call a tool, and an HTTP endpoint anyone can POST to.
Every change you make is written to the live workflow about half a second
after you stop. That is fine for the throwaway you are about to build, and it
is the single most important thing to know before you open a workflow anyone
depends on. Snapshot first: dibbla revisions create <workflow>.
1. Start from genuinely empty
Go to workflows.dibbla.com/app/ with nothing after the slash. You get a list, headed Pick Workflow, with New Workflow at the top.
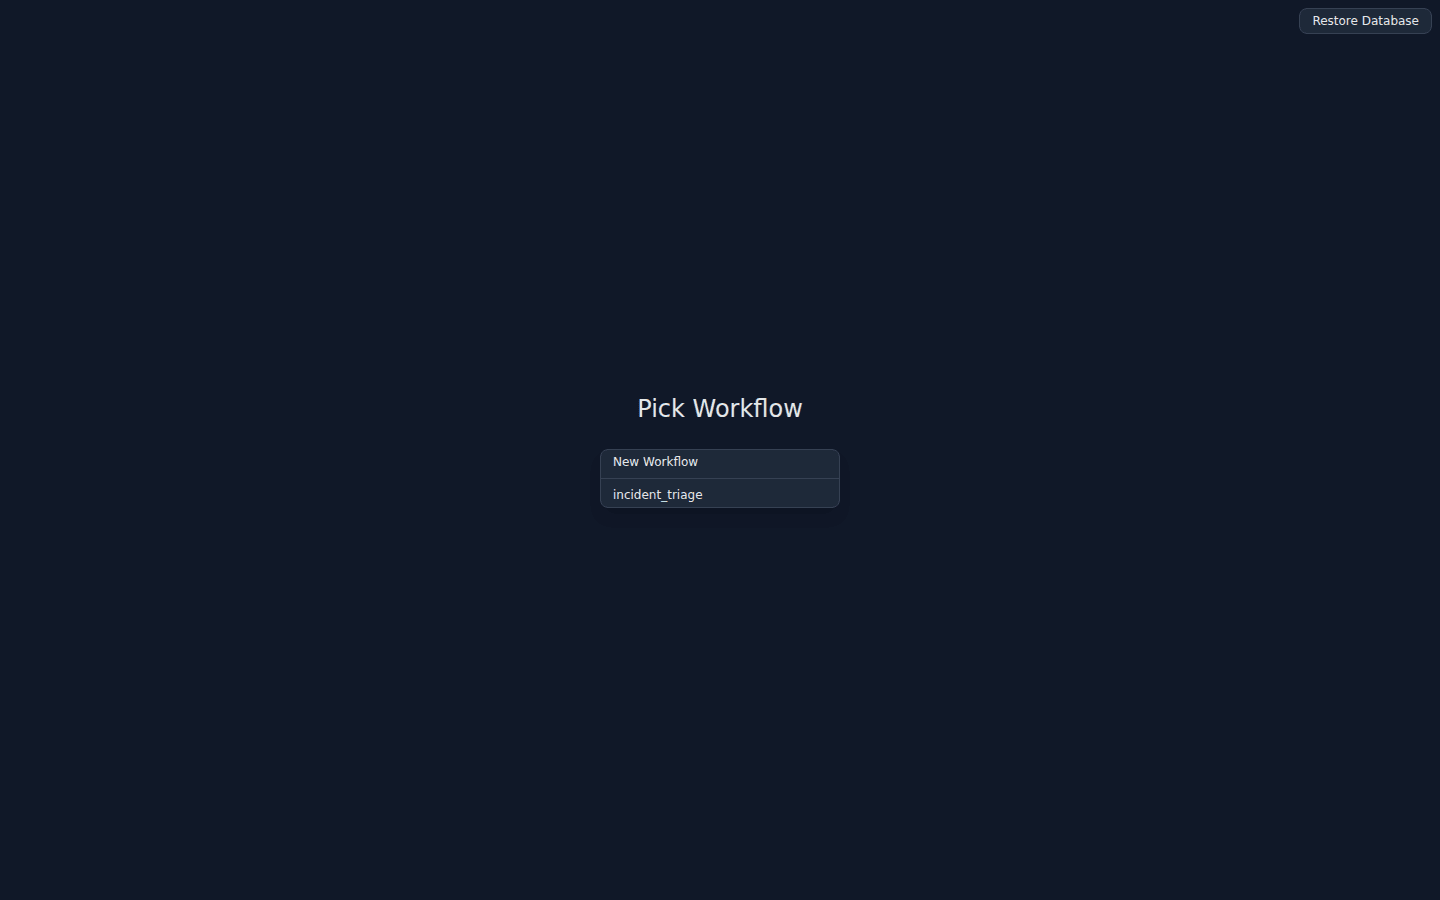
Name it — letters, digits and underscores only — and press Create.
The + NEW WORKFLOW button on the dashboard, and the same entry in the editor’s menu, both go through a starter-template picker instead. Templates are useful later; they are a bad way to learn, because you arrive at a graph somebody else built.
The canvas that opens is completely empty — no hint, no placeholder, nothing inviting you to start. That is not a loading state.
2. Right-click is the palette
Right-click anywhere on the canvas. This is the only way to add anything:
there is no sidebar, no drag source, no + button.
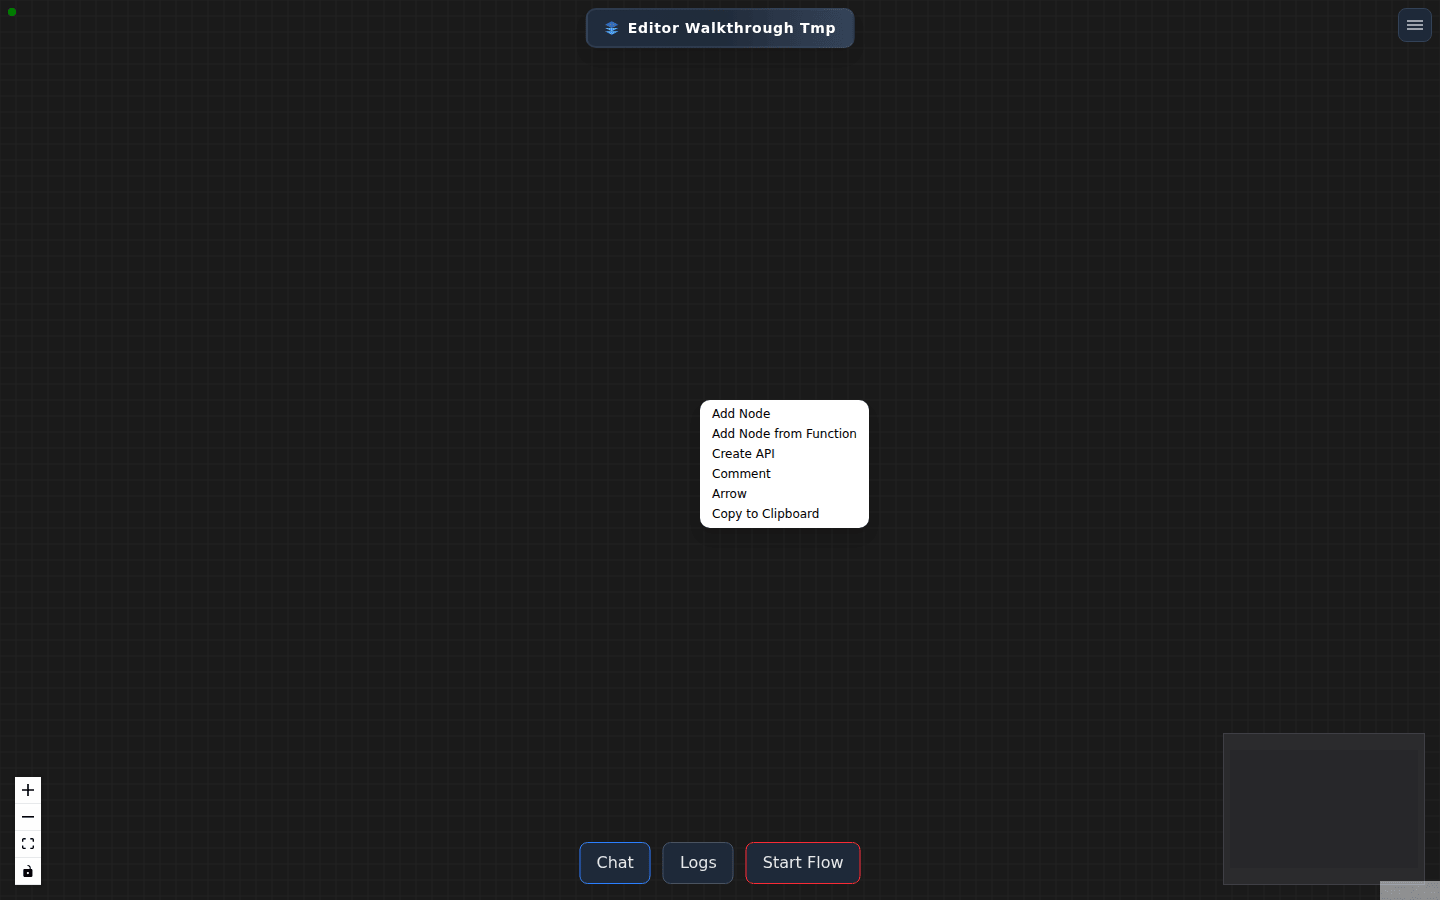
Three of those entries matter:
| Entry | What it does |
|---|---|
| Add Node | opens an empty node editor — you pick the function afterwards |
| Add Node from Function | pick from the registry first; the node appears immediately, no dialog |
| Create API | inserts the request and response pair in one go |
3. Create the way in and the way out
Right-click and choose Create API. Two nodes appear — and they land on top of each other, so drag one aside.
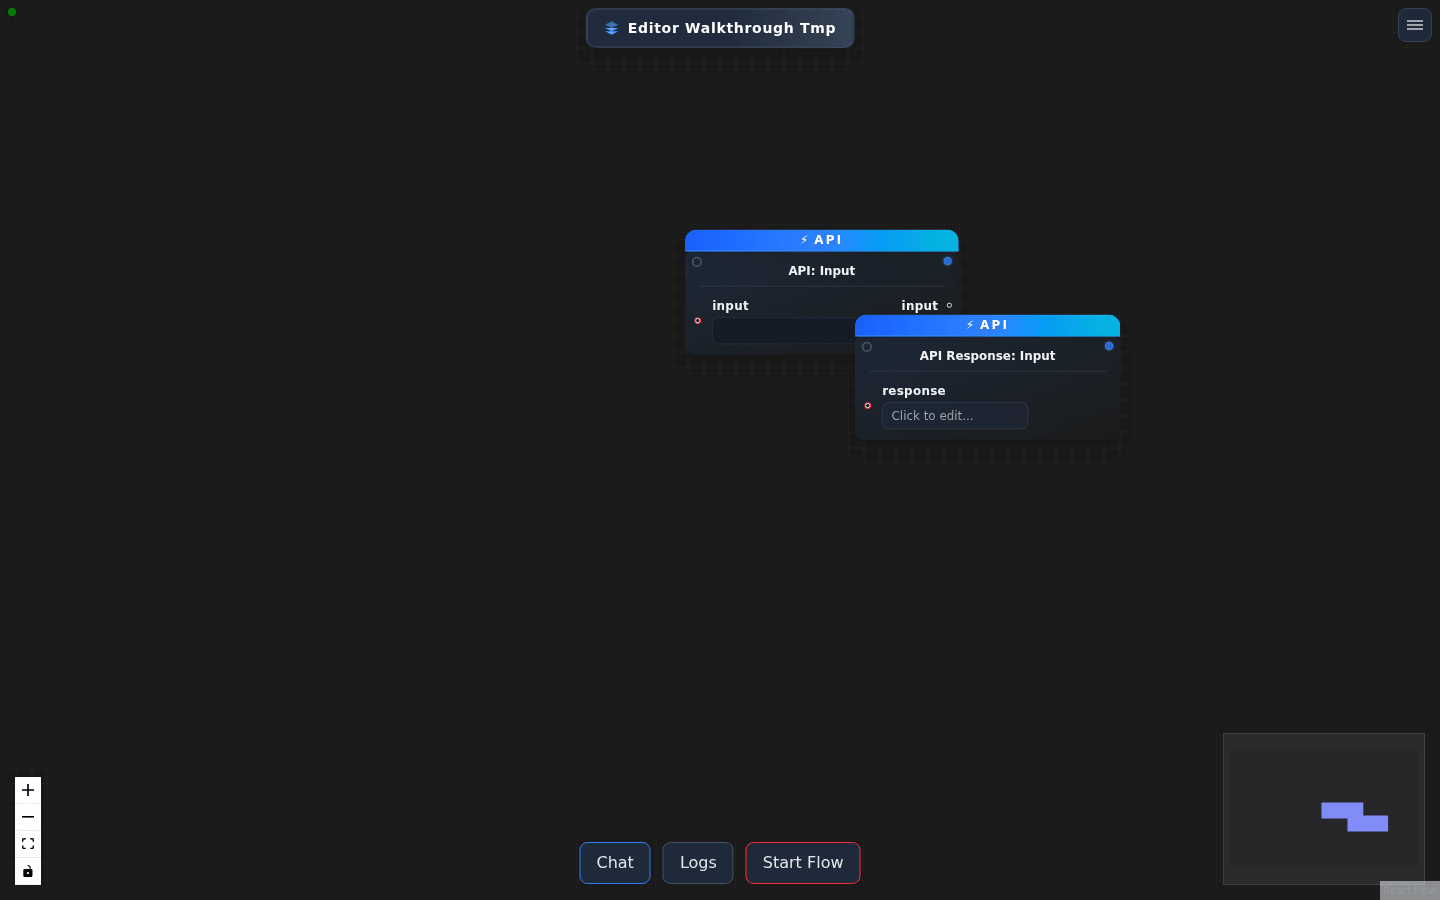
This inversion catches everyone once. The API node’s outputs are the JSON fields a caller sends in. The API Response node’s inputs are the fields they get back. Open either node and you will see the other panel greyed out with the words Synced from outputs — that is the editor telling you the same thing.
So: to add a field to the request, add an output to the API node.
4. Add the agent
Right-click again and choose Add Node from Function. The submenu lists every function the platform currently has.
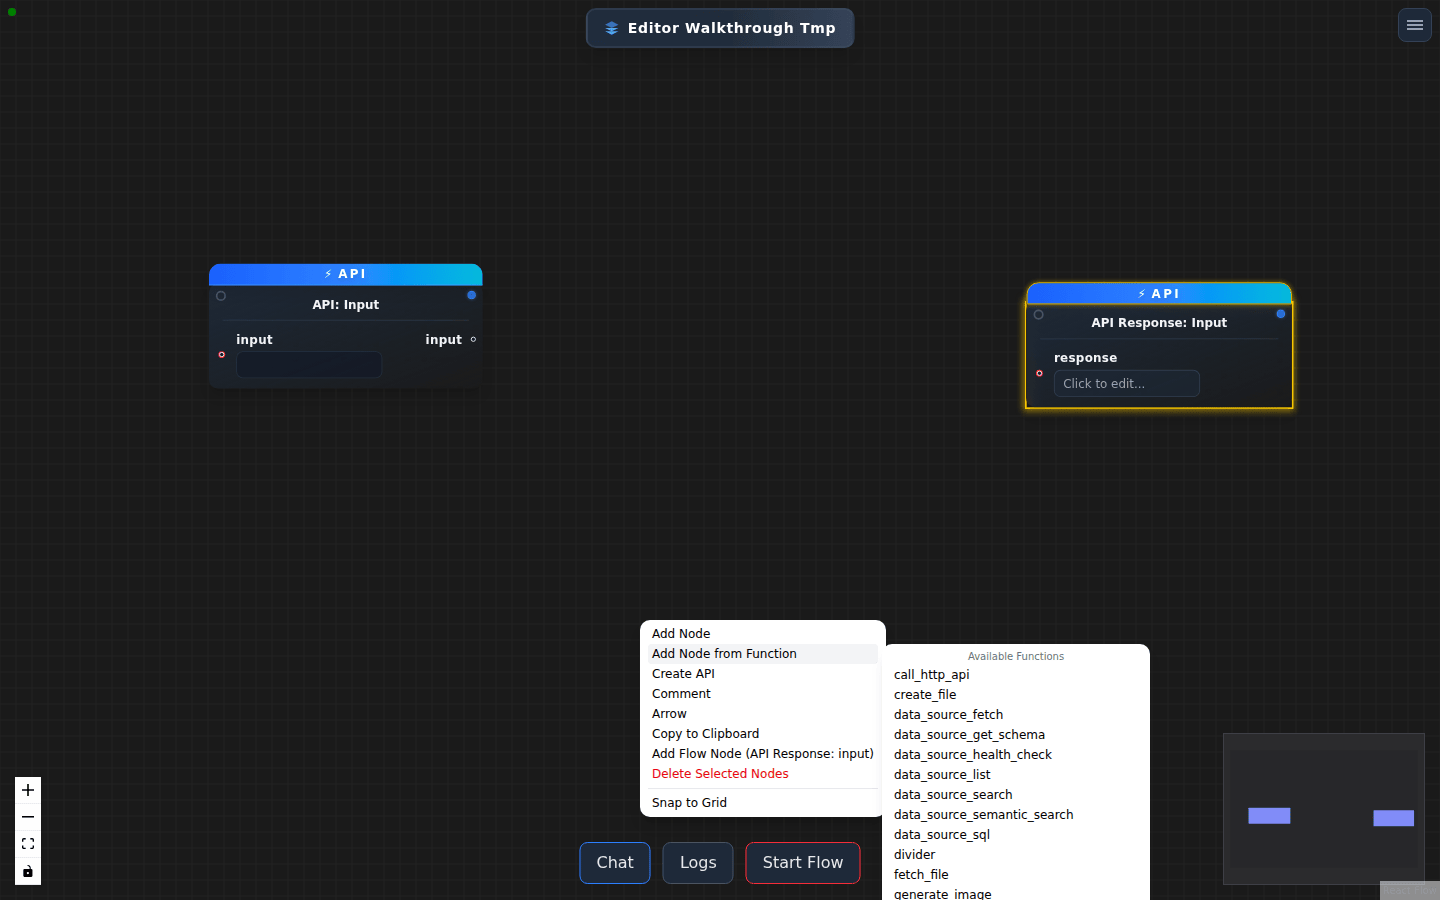
Pick reasoning_agent_with_toolbox. It is the agent to start with: it can
hold tools, memory and structured output, where the plainer agent functions
cannot.
The node appears straight away, with a green AGENT rail.
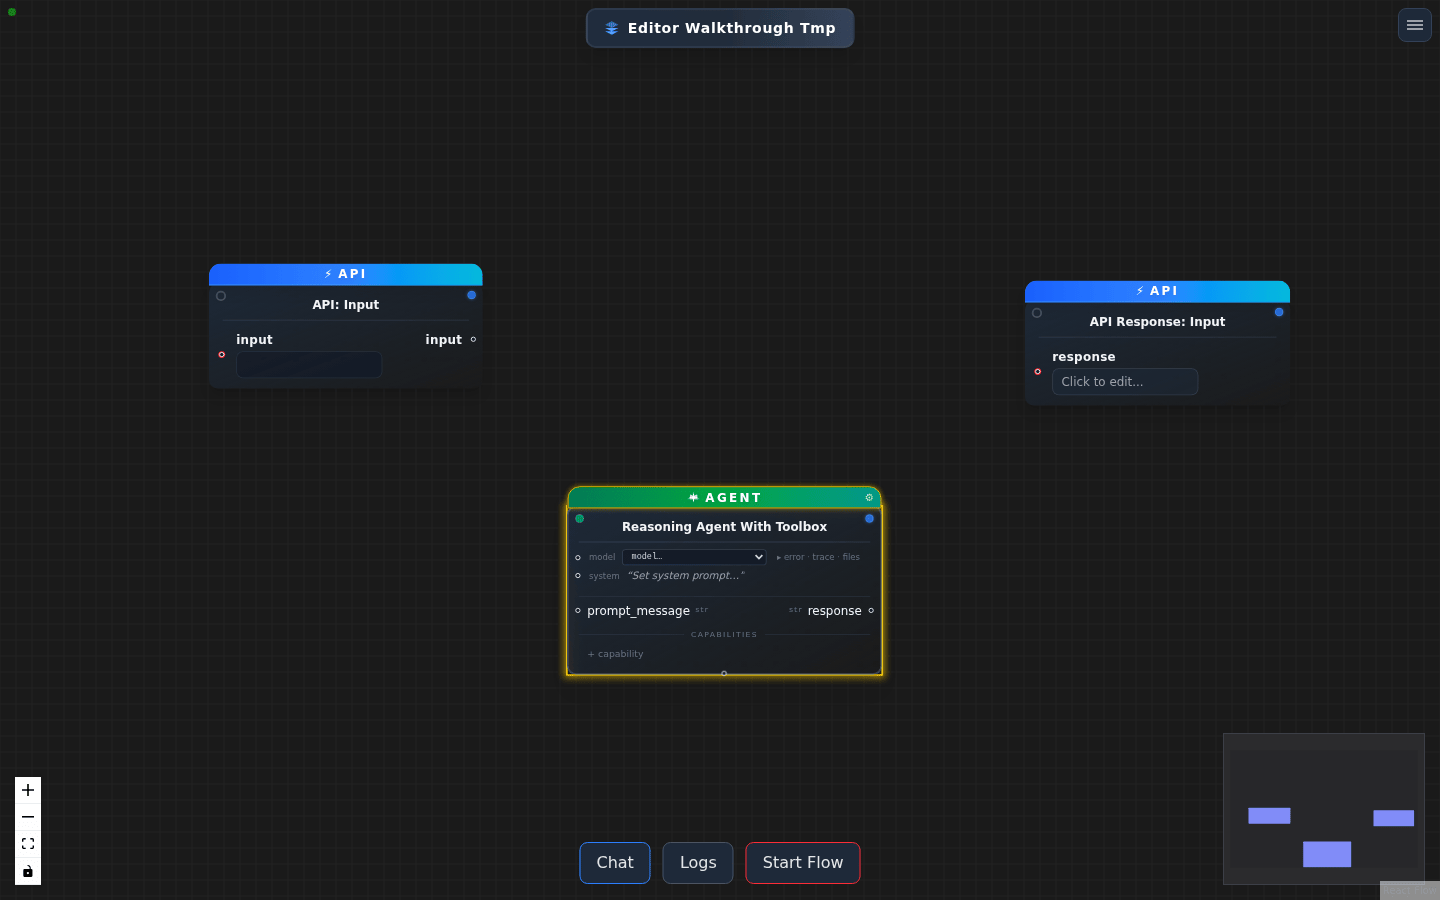
Everything you need is on the node body:
- a
modeldropdown - a
systemline — click it and type the agent’s instructions prompt_messagein andresponseout, always present- a CAPABILITIES section, empty until you add one
The dropdown is not a fixed list in the editor. It is published by the
server, and contains only models whose provider key is actually configured.
The dibbla/ entries route through the platform’s own gateway, so the
usage is attributed to your organisation rather than to a provider account —
prefer those.
5. Wire it up
Drag from an output dot on the right of one node to an input dot on the left of the next. Two edges:
- the API node’s field → the agent’s
prompt_message - the agent’s
response→ the API Response node’s field
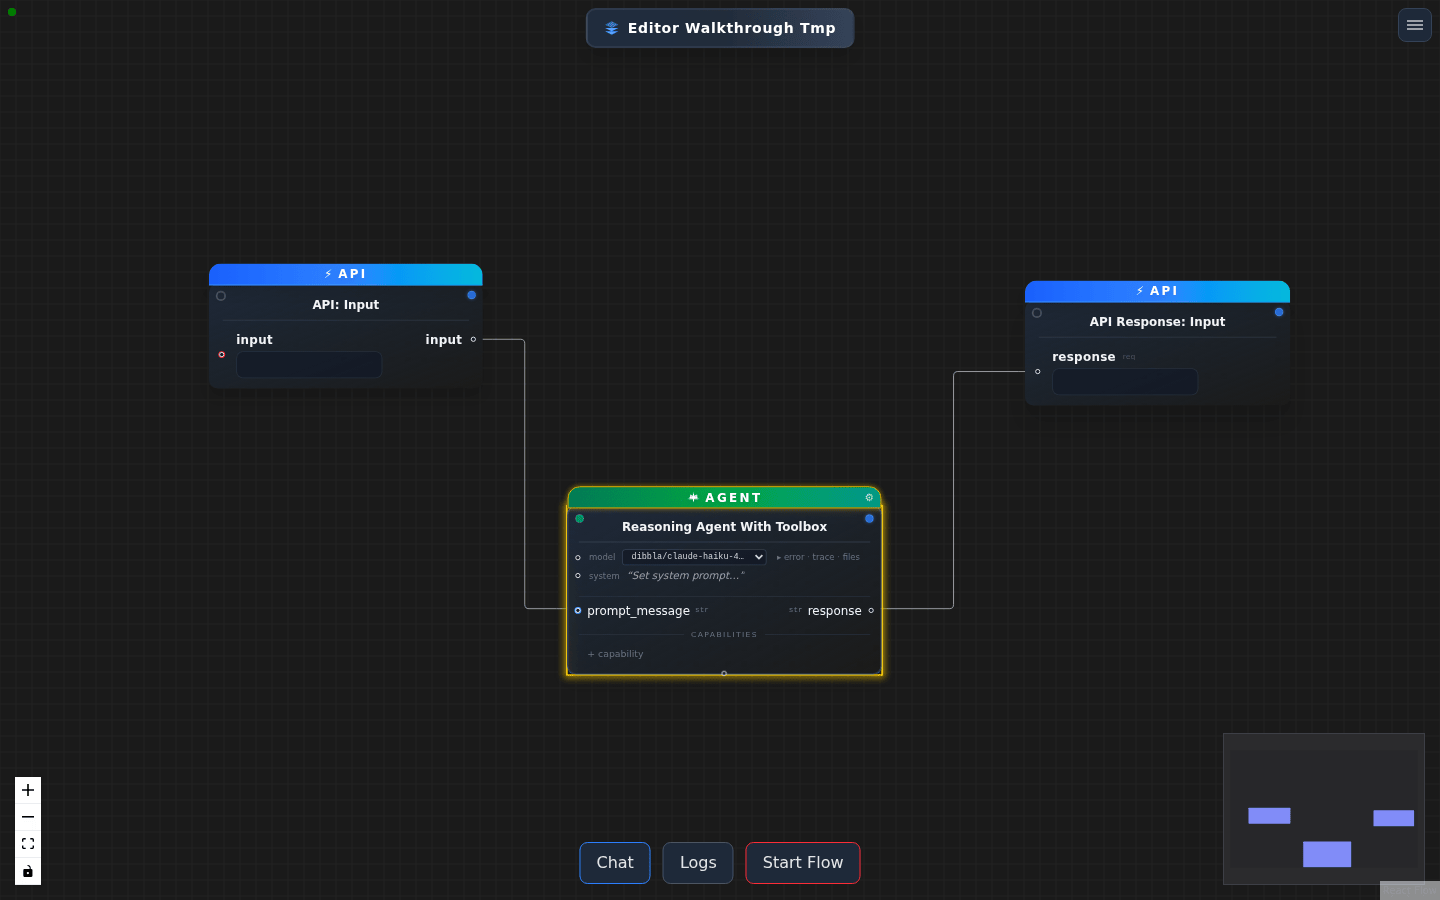
There is no validation while you drag and no refusal on drop. An impossible edge is created, looks exactly like a real one, and is silently removed the next time the graph loads — so a connection you were sure you made can simply be gone. Reload after wiring and check the edges are still there.
6. Give it a tool
An agent without tools is just a prompt. Click + capability on the node.
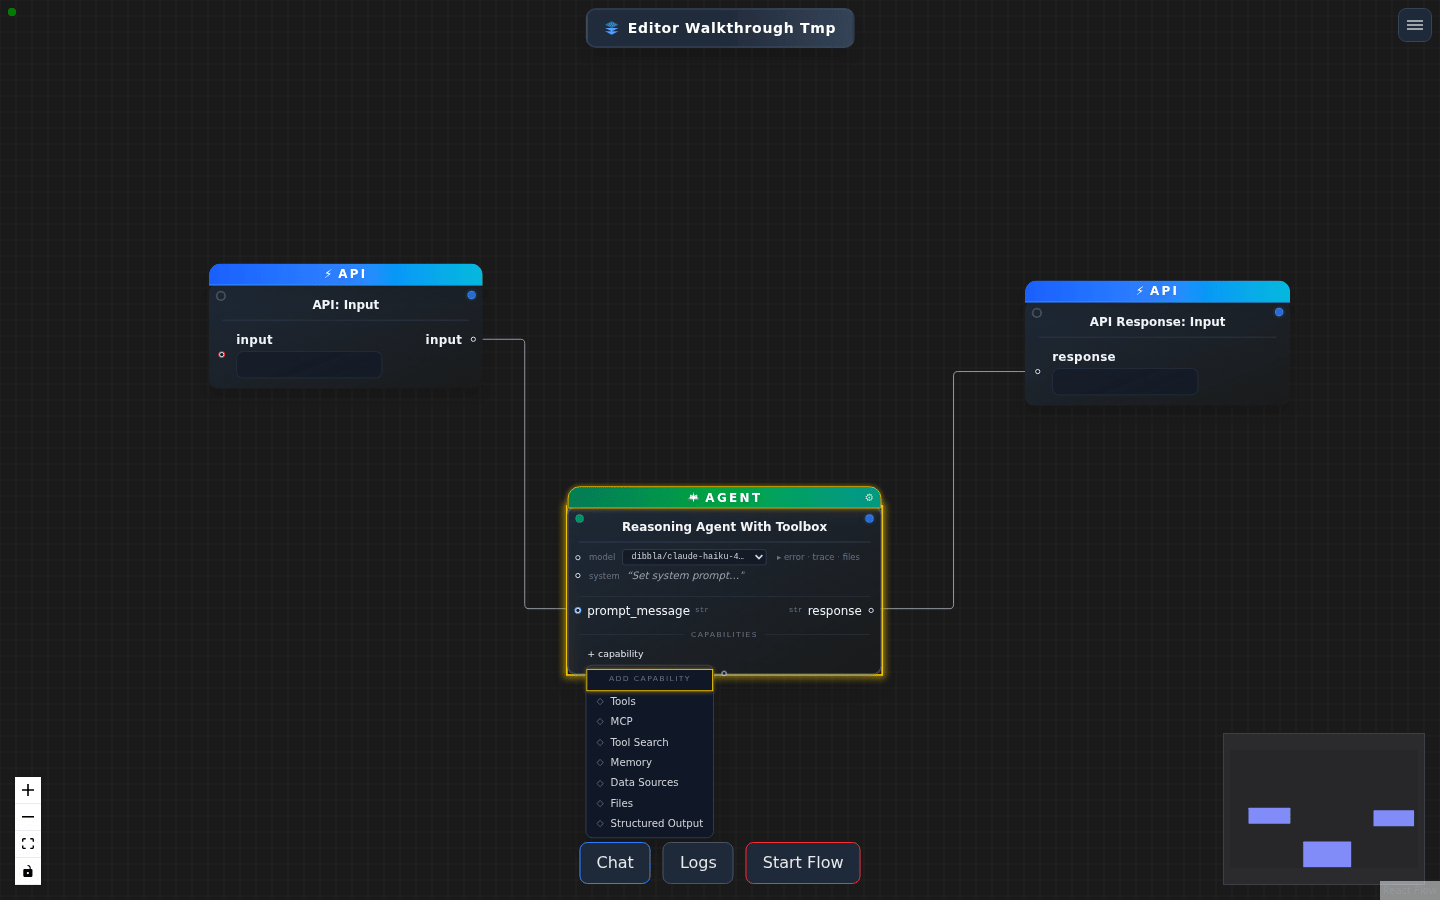
Choose Tools. A Tools row appears under CAPABILITIES. Click the ›
at the end of that row to open the configuration panel, then + tool, and
search:
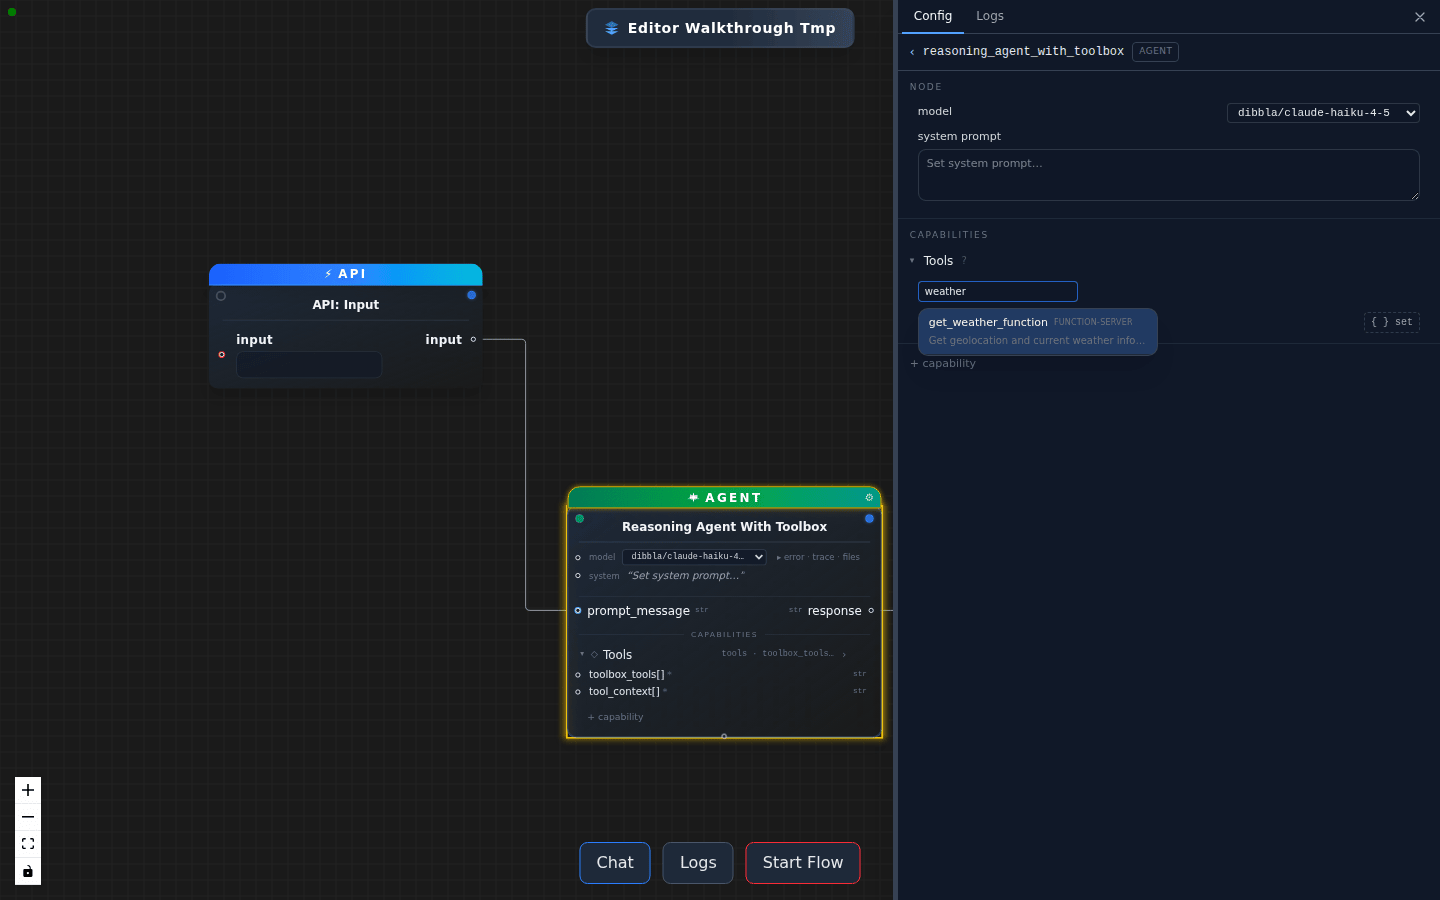
Press Enter and the function becomes a chip on the agent. That is the whole attachment.
The other direction
You can also put the tool on the canvas as its own node — Add Node from Function, then the Tool button in its editor — and drag a wire from the small dot on the agent’s bottom edge to the small dot in the tool node’s top rail. Same result.
The difference is worth knowing:
| Toolbox chip | Canvas wire | |
|---|---|---|
| Stored as | a name, resolved when the workflow runs | an edge to that exact node |
| Survives the function being replaced | yes — it follows the registry | no — it points at the node you drew |
| Visible on the canvas | no | yes, as a wire |
There is one edge style in the editor. A tool connection and a data connection are the same colour, the same thickness, and carry no label. The only things telling them apart are direction — tool wires run bottom to top, data wires left to right — and dot size, since tool ports are much smaller. On a busy graph, this is genuinely hard to read.
7. Run it, right there
Start Flow, bottom centre. Status dots on each node go yellow while it works and green when it finishes; edges pulse as data crosses them. Logs opens a timeline with a progress count.
Nothing to save first — the editor flushes any pending change before the run, because what executes is the server’s copy, not what is on your screen.
8. Call it from anywhere else
Click Chat. A panel opens beside the canvas: you can talk to the workflow here, through the same endpoint an external caller would use.
The document icon in that panel’s header opens the endpoint’s documentation:
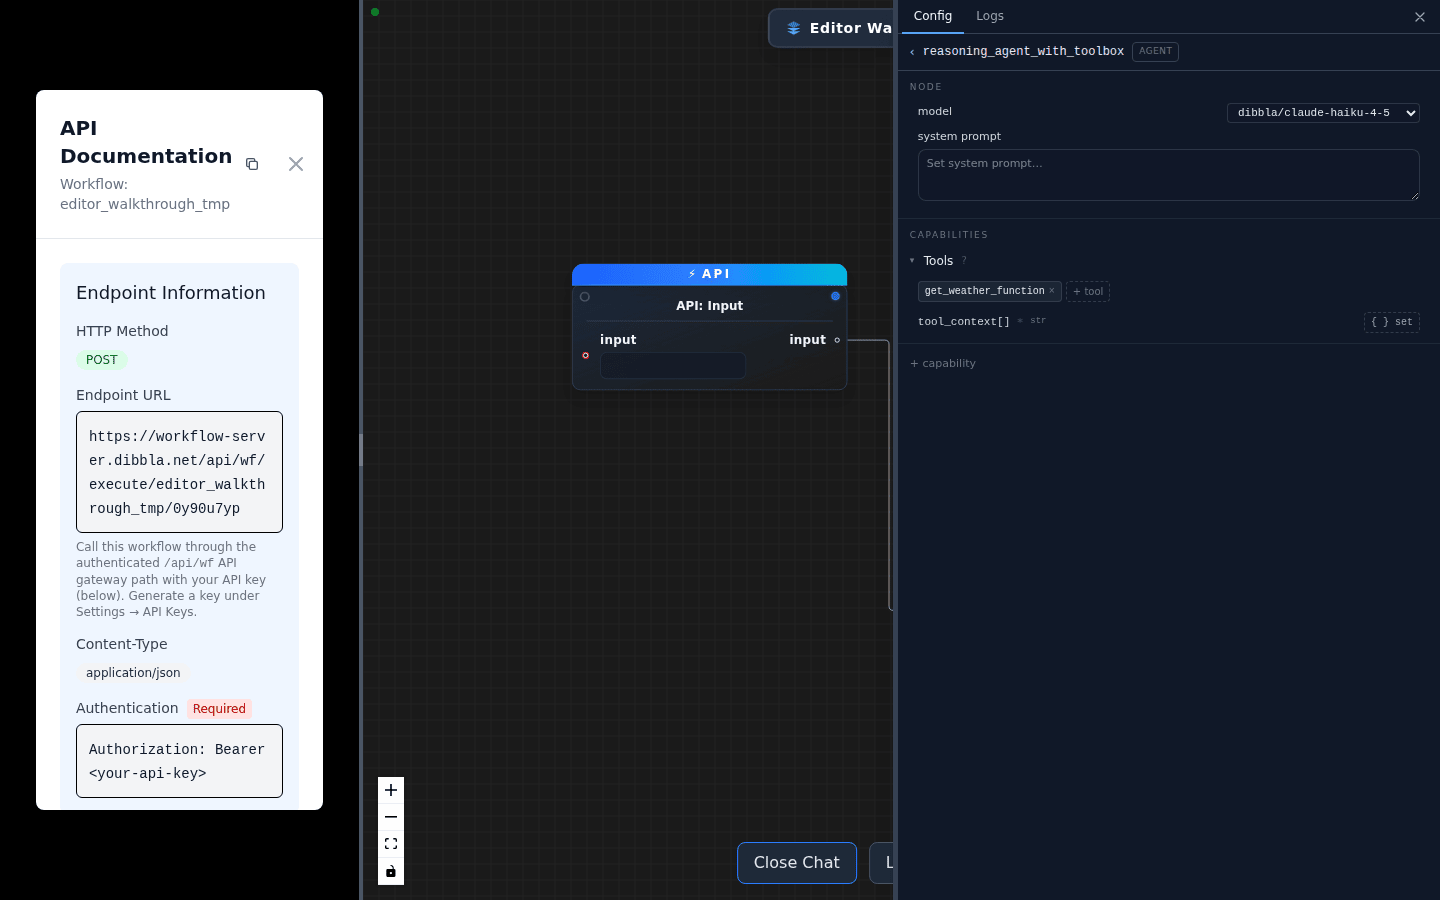
It gives you the method, the URL, Content-Type: application/json, the
Authorization: Bearer header, and a copyable curl with your own field
names already filled in — because it is generated from the graph rather than
written by hand.
Mint the key it asks for under Settings → API Keys.
The host in that URL is built from the server’s configured base address, so
it differs between environments — a capture taken against a development
instance shows an internal service name where production shows the public
gateway. The part that matters, and that is stable, is
/api/wf/execute/<workflow>/<id>.
dibbla wf api-docs <workflow> prints the endpoint without opening a
browser — useful when you want to paste it into a script.
Where to go next
- Connect it to your app — call this endpoint from your own code, or register your own functions so they appear in that submenu.
- Runs and logs — what to look at when a run does something you did not expect.
- Workflow YAML reference — the same graph as a file you can review and diff. Worth knowing once the workflow matters to somebody other than you.