
Runs and logs
Watching a run while it happens, finding one afterwards, and the log-persistence rule that explains why a finished run looks quiet.
Every execution is a run with an id, a status, logs and an output. There are two moments you care about: while it is happening, and afterwards.
This page is the workflow and pipeline run surface. The maintenance agent is a different overnight look at a deployed app: it has its own history, its own typed outcomes, and it never writes this run log. Do not tail a workflow run expecting to see what the agent found.
While it happens
Executing with --follow starts the run and tails it:
$dibbla wf execute incident_triage --follow --data '{"question":"..."}'
Started run b6034b16-… — tailing logs
…
run completed
$dibbla wf execute incident_triage --async --data '{...}'
# returns run metadata immediately

$dibbla wf logs <runId> --follow
$dibbla wf runs output <runId>
The editor shows the same stream in its Logs panel, which is useful when you are looking at the graph anyway:
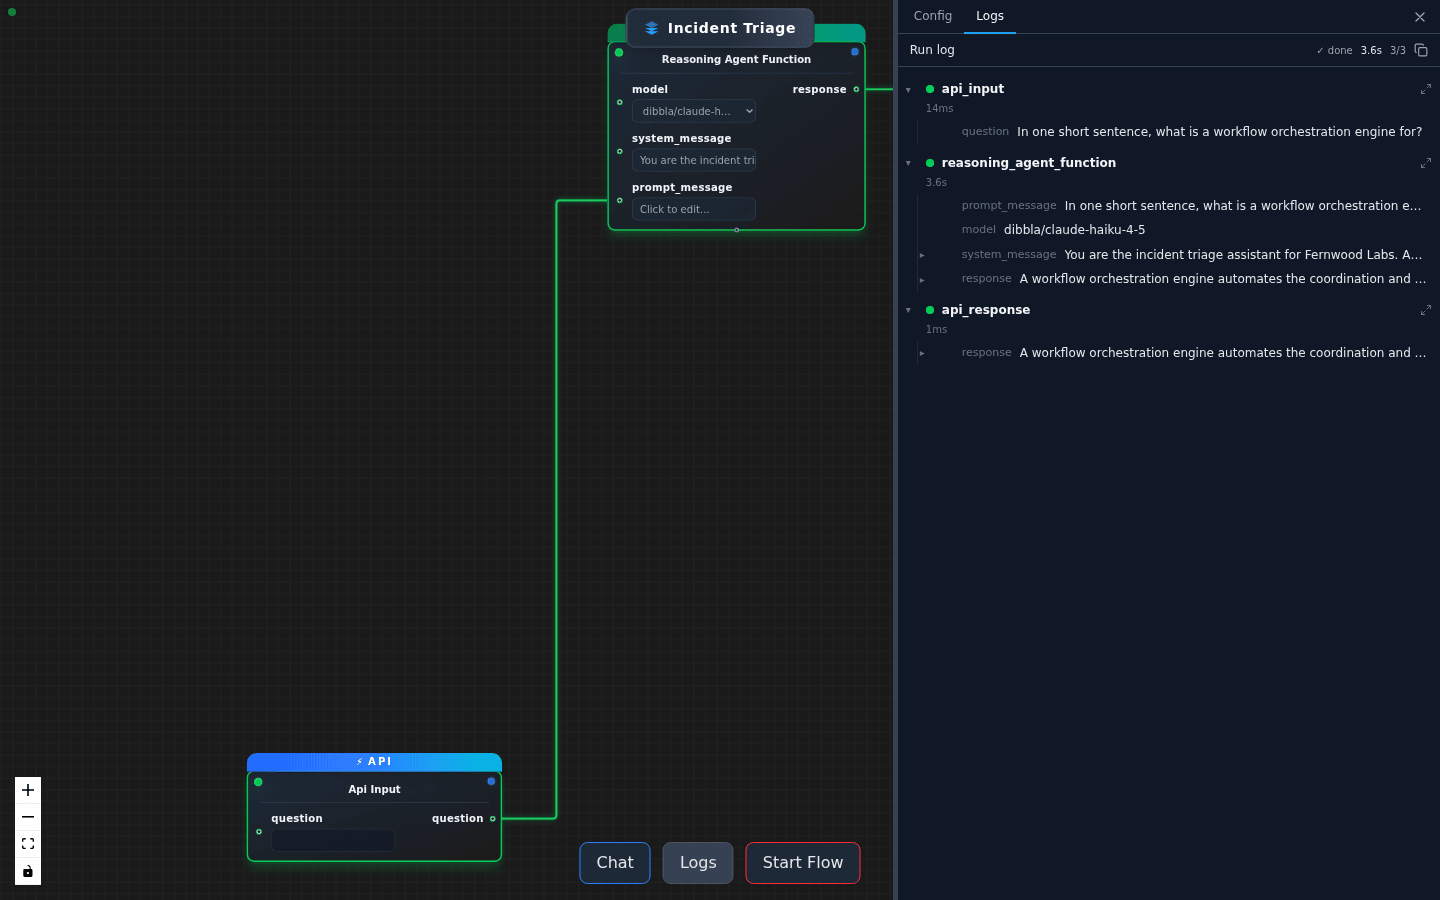
It shows whatever streams while you have that workflow open — including a run you triggered from the CLI, as long as the editor was already open. What it cannot show you is a run that finished before you opened the tab: the panel is built from what arrived over the socket, not from stored history. Use the Runs view for anything in the past.
Afterwards
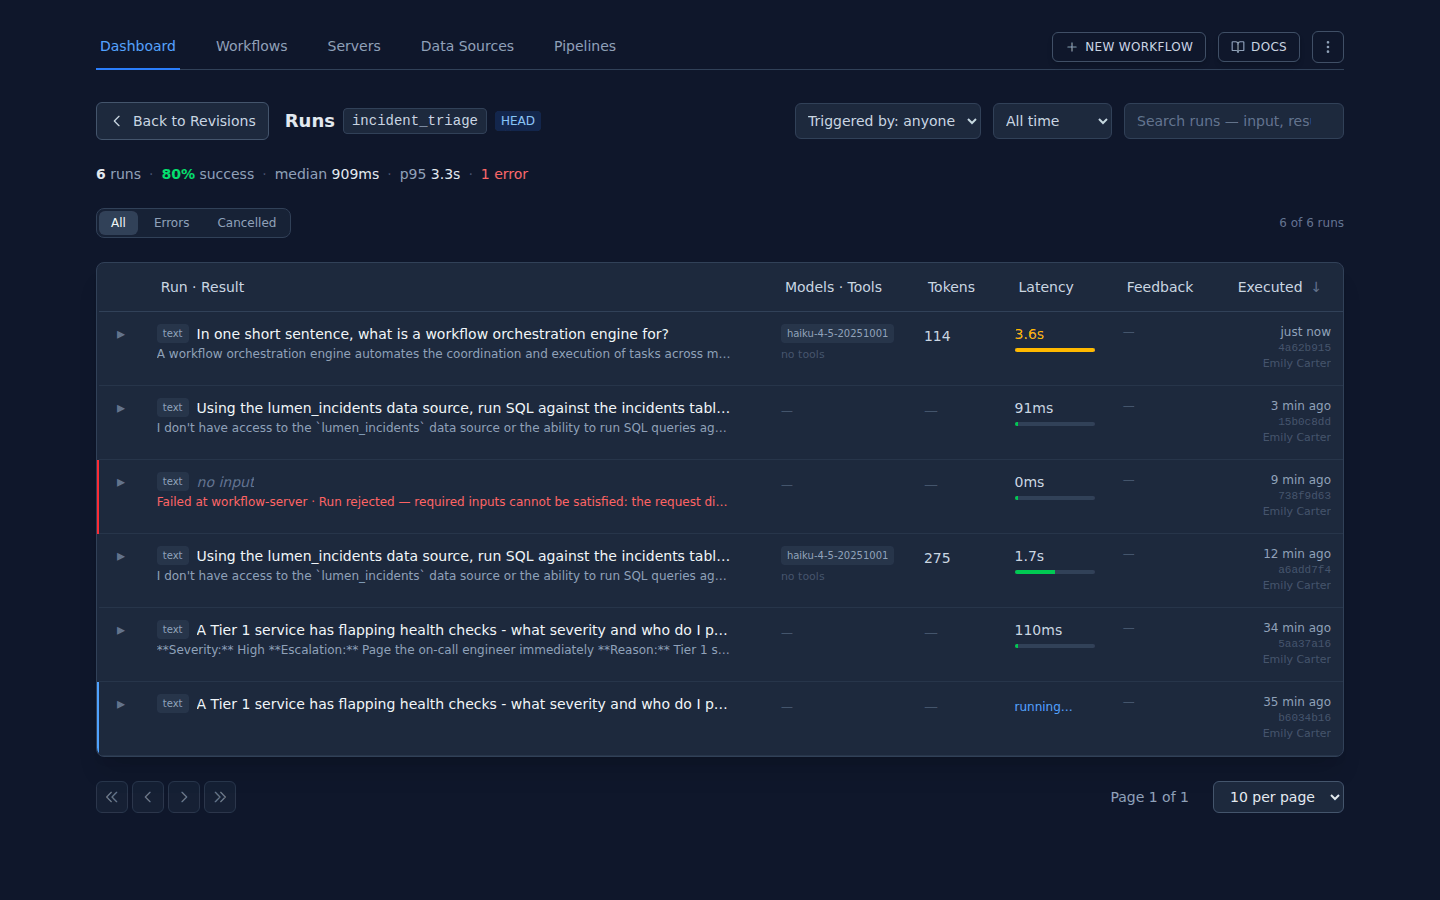
$dibbla wf runs list
$dibbla wf runs list -w incident_triage -n 20

$dibbla wf runs output <runId>
Only WARN and ERROR lines are persisted, plus the terminating
run completed marker. INFO and DEBUG are live-only. So tailing a run
that finished an hour ago can show almost nothing, and that is not a bug —
it means nothing went wrong. For the full picture of a finished run, use
wf runs output, not wf logs.
When a run does not finish
A run that neither completes nor errors is the confusing case. In order:
--followit. A watchdog reports a stalled run within about 30 seconds, with a per-input diagnosis — far more useful than waiting out the server-side timeout.- Check the worker. If the graph calls functions from your own execution server and that process is gone, the dispatch has nowhere to land.
- Suspect input types.
function execution failedis the same message whether your handler returned an error or the arguments failed to deserialize, so the message alone will not tell you which. Type mismatches are the most common cause: sendtrue, not"true";42, not"42". A panic is the one case that is distinguishable — it logspanic during function executionwith a stack, so if you do not see that, your code ran and something else went wrong.
Triggering on a schedule
Cron-triggered runs are covered in Pipelines and schedules, which is also where the scheduler’s own quirks live.